/*-----------------------------+
|			       |
| Shared by www.Aptrafx.com    |
|			       |
+------------------------------*/

//+--------------------------------------------------------------------+
//|                                                   TII_RLH          |
//|                                    Copyright © 2006, Robert Hill   |
//|                                       http://www.metaquotes.net/   |
//|                                                                    |
//| Based on the formula developed by M. H. PEE                        |
//|                                                                    |
//| Trend Intensity Index.                                             |
//|                                                                    |
//| TII is used to indicate the strength of the current trend in the   |
//| market. The stronger the current trend, the more likely the        |
//| market will continue moving in the current direction.              |
//| It is recommended to enter the market during a strong trend        |
//| and ride it until TII shows signs of a reversal, at which time     |
//| you should abandon your position and prepare to enter in the       |
//| opposite direction.                                                |
//| Pee recommends using a major period of 60 and a minor period of 30.|
//| Assuming these setting, TII is calculated as follows.              |
//| The 60 bar simple moving average (MA) is computed.                 |
//| The deviation between the closing price and this computed average  |
//| for each of the last 30 bars is computed (CL - MA).                |
//| Positive deviations (CL > MA) are summed to give SDPOS.            |
//| Negative deviations (CL < MA) are summed to give SDNEG.            |
//| Then, the 30 period TII is calculated as:                          |
//|     100 * SDPOS / (SDPOS - SDNEG).                                 |
//| TII ranges from a lower limit of 0 to an upper limit of 100        |
//| A TII value above 50 signals an uptrend                            |
//| A TII value of 80 means that 80% of the total deviations are up    |
//| When TII fall below 50, a downtrend is likely in place             |
//| 50 represents a level that is trend-neutral                        |
//| The closer TII is to 100, the stronger the current uptrend         |
//| The closer TII is to 0, the stronger the current downtrend         |
//|                                                                    |
//+--------------------------------------------------------------------+
#property  copyright "Copyright © 2006, Robert Hill "
#property  link      "http://www.metaquotes.net/"

//---- indicator settings
#property  indicator_separate_window
#property  indicator_buffers 1
#property  indicator_color1  Red
#property  indicator_width1  2

extern int Major_Period = 60;
extern int Minor_Period = 30;

//---- buffers
double ma[];
double ma_dev[];
double tii[];


//+------------------------------------------------------------------+
//| Custom indicator initialization function                         |
//+------------------------------------------------------------------+
int init()
  {

//---- drawing settings
   IndicatorBuffers(3);

   SetIndexStyle(0,DRAW_LINE);
   SetIndexDrawBegin(0,Major_Period);
   IndicatorDigits(MarketInfo(Symbol(),MODE_DIGITS)+2);

//---- 3 indicator buffers mapping
   if(!SetIndexBuffer(0,tii) &&
      !SetIndexBuffer(1,ma_dev) &&
      !SetIndexBuffer(2,ma))
      Print("cannot set indicator buffers!");
//---- name for DataWindow and indicator subwindow label
   IndicatorShortName("TII("+Minor_Period+")");
//---- initialization done
   return(0);
  }

int start()
{
   int i,j,  limit;
   double sdPos, sdNeg;
   int    counted_bars=IndicatorCounted();
   if(counted_bars>0) counted_bars--;
   limit=Bars-counted_bars;

   for(i = limit; i >= 0; i--)
   {
       ma[i] = iMA(NULL,0,Major_Period,0,MODE_SMA,PRICE_CLOSE,i);
       ma_dev[i] = Close[i] - ma[i];
   }


//========== COLOR CODING ===========================================

   for(i = 0; i <=limit; i++)
   {
       sdPos = 0;
       sdNeg = 0;
       for (j=i;j<i+30;j++)
       {
          if (ma_dev[j] >= 0) sdPos = sdPos + ma_dev[j];
          if (ma_dev[j] < 0) sdNeg = sdNeg + ma_dev[j];
       }
       tii[i] = 100 * sdPos/(sdPos - sdNeg);
   }

   return(0);
}
//+------------------------------------------------------------------+
Sample
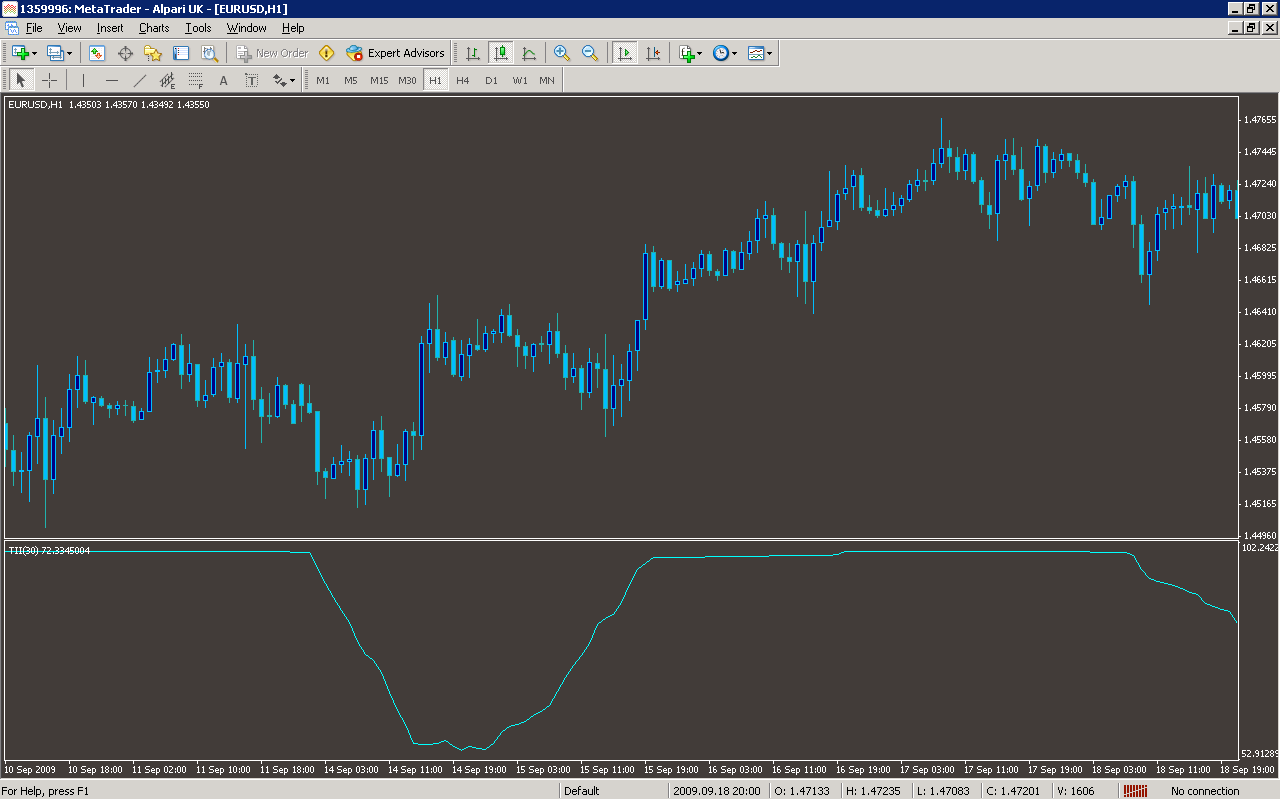
Analysis
Market Information Used:
Series array that contains close prices for each bar
Indicator Curves created:
Implements a curve of type DRAW_LINE
Indicators Used:
Moving average indicator
Custom Indicators Used:
Order Management characteristics:
Other Features: