//+------------------------------------------------------------------+
//|                                                                  |
//|                        TrailCD.mq4                               |
//|Èíäèêàòîð                                                         |
//|Ñõîæäåíèå/ðàñõîæäåíèå áûñòðîãî è ìåäëåííîãî òðàëîâ                |
//+------------------------------------------------------------------+
#property copyright "mandorr@gmail.com"
#property indicator_separate_window
#property indicator_buffers 1
#property indicator_color1 SkyBlue
#property indicator_maximum  0.0050
#property indicator_minimum -0.0050
//----
extern int TrailFast=25;     // Áûñòðûé òðàë
extern int TrailSlow=65;     // Ìåäëåííûé òðàë
extern int CountBars=1000;   // Êîëè÷åñòâî îòîáðàæàåìûõ áàðîâ
//----
double buffer[];
//+------------------------------------------------------------------+
//|                                                                  |
//+------------------------------------------------------------------+
void init()
  {
   SetIndexStyle(0,DRAW_HISTOGRAM,0,2);
   SetIndexBuffer(0,buffer);
   SetIndexLabel(0,"Value");
   SetIndexDrawBegin(0,0);
  }
//+------------------------------------------------------------------+
//|                                                                  |
//+------------------------------------------------------------------+
void start()
  {
   ArrayInitialize(buffer,0);
   int price=MathRound(Close[CountBars-1]/Point);
   int value_fast=price;
   int value_slow=price;
   for(int i=CountBars-1;i>=0;i--)
     {
      price=MathRound(Close[i]/Point);
      if (value_fast<price-TrailFast) value_fast=price-TrailFast;
      if (value_fast>price+TrailFast) value_fast=price+TrailFast;
      if (value_slow<price-TrailSlow) value_slow=price-TrailSlow;
      if (value_slow>price+TrailSlow) value_slow=price+TrailSlow;
      buffer[i]=(value_fast-value_slow)*Point;
     }
  }
//+------------------------------------------------------------------+
Sample
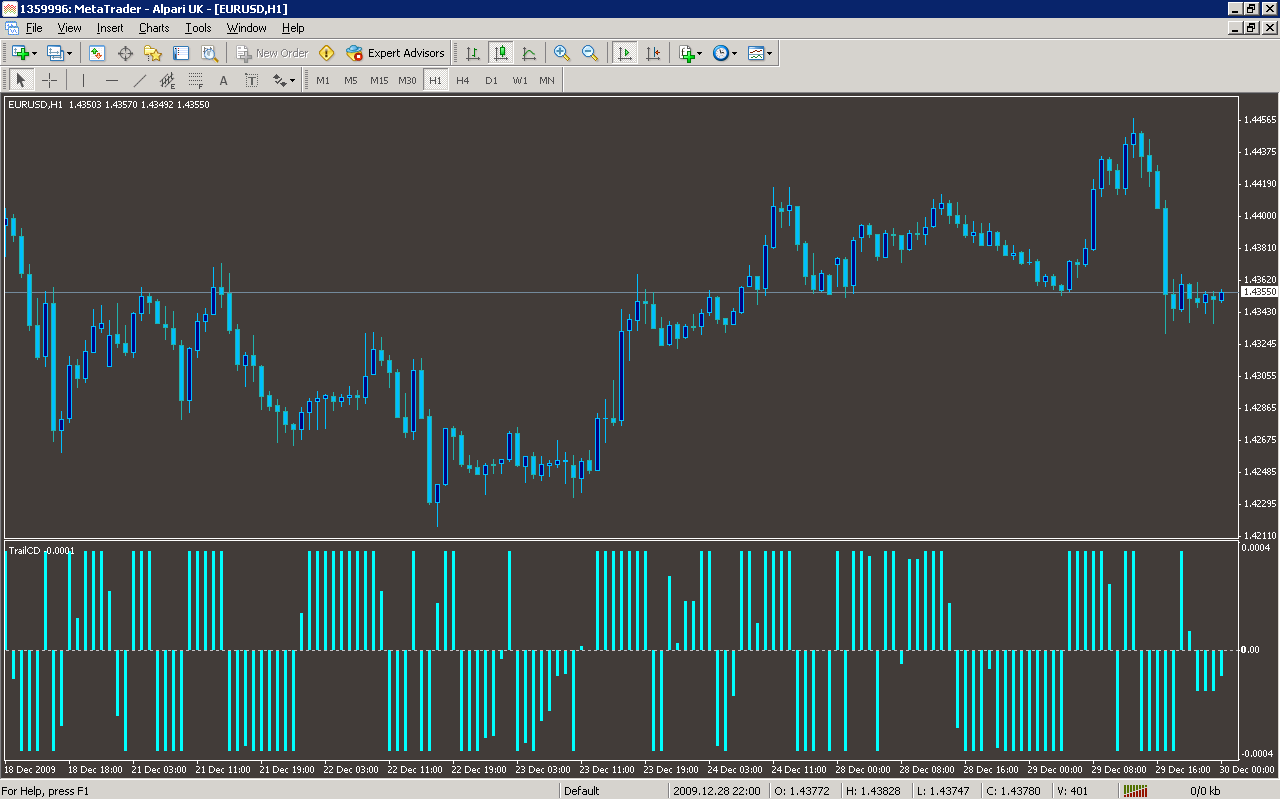
Analysis
Market Information Used:
Series array that contains close prices for each bar
Indicator Curves created:
Implements a curve of type DRAW_HISTOGRAM
Indicators Used:
Custom Indicators Used:
Order Management characteristics:
Other Features: