//+------------------------------------------------------------------+
//|                                                     trend_v3.mq4 |
//|                      Copyright © 2008, MetaQuotes Software Corp. |
//|                                        http://www.metaquotes.net |
//+------------------------------------------------------------------+
#property copyright "Copyright © 2008, MetaQuotes Software Corp."
#property link      "http://www.metaquotes.net"

#property indicator_chart_window
#property  indicator_buffers 5
#property  indicator_color1  Blue
#property  indicator_color2  Black
#property  indicator_color3  Black
#property  indicator_color4  Red
#property  indicator_color5  Black

extern int period =20;
double A[],C[],D[],C1[],C2[];
//+------------------------------------------------------------------+
//| Custom indicator initialization function                         |
//+------------------------------------------------------------------+
int init()
  {
//---- indicators

  SetIndexStyle(0,DRAW_LINE);
  SetIndexBuffer(0,A);
  SetIndexDrawBegin(0,0);

  SetIndexStyle(1,DRAW_LINE);
  SetIndexBuffer(1,D);
  SetIndexDrawBegin(1,0);

    SetIndexStyle(2,DRAW_LINE);
  SetIndexBuffer(2,C);
  SetIndexDrawBegin(2,0);
      SetIndexStyle(3,DRAW_LINE);
  SetIndexBuffer(3,C1);
  SetIndexDrawBegin(3,0);
      SetIndexStyle(4,DRAW_LINE);
  SetIndexBuffer(4,C2);
  SetIndexDrawBegin(4,0);

//----
   return(0);
  }
//+------------------------------------------------------------------+
//| Custom indicator deinitialization function                       |
//+------------------------------------------------------------------+
int deinit()
  {
//----

//----
   return(0);
  }
//+------------------------------------------------------------------+
//| Custom indicator iteration function                              |
//+------------------------------------------------------------------+

int start()
  {

   int    counted_bars=IndicatorCounted();
   int   i, j, k, q, limit;
   double X[2][2], Y[2], B[2], x[2][2000], y[2000], a,sr,sr1,sr2;

  limit=Bars-counted_bars;
  for(q=0; q<limit; q++)
   {

   ArrayInitialize(X,0);
   ArrayInitialize(Y,0);
   ArrayInitialize(B,0);
   ArrayInitialize(x,0);
   ArrayInitialize(y,0);
//===========================================
for (i=0; i<=period; i++) {
x[0][i]=1;
x[1][i]=i+q;
y[i]=   Close[i+q];
}
//===========================================
  for (k=1; k<=period; k++) {
  for (j=0; j<=1; j++) {
  for (i=0; i<=1; i++) {
   X[i][j]=x[j][k]*x[i][k]+X[i][j];
   }
   Y[j]=y[k]*x[j][k]+Y[j];
   }}
//===========================================
k=0;
 j=1;
  a=X[k][j]/X[k][k];
  for (i=0; i<=3; i++){
  X[i][j]=X[i][j]-X[i][k]*a;
  }
  Y[j]=Y[j]-Y[k]*a;

//==========================================
for (k=2; k>=1; k--){
a=0;
for (i=1; i>=k; i--){
a=X[i][k-1]*B[i]+a;
}
B[k-1]=(Y[k-1]-a)/X[k-1][k-1];
}
//=========================================


   A[q]=B[0]+B[1]*q;
  A[q]=B[0]+B[1]*q;
   if(B[1]<0){C1[q]=B[0]+B[1]*q;}
  if(B[1]==0){C2[q]=B[0]+B[1]*q;}

  for(j=q; j<=q+period; j++){
sr1=MathAbs(High[j]-(B[0]+B[1]*(j)))+sr1;
sr2=MathAbs(Low[j]-(B[0]+B[1]*(j)))+sr2;
}
sr1=sr1/period;
sr2=sr2/period;
 D[q]=B[0]+2*sr1+B[1]*(q);
C[q]=B[0]-2*sr2+B[1]*(q);


   }


//}
//=========================================

   return(0);
  }
//+------------------------------------------------------------------+
Sample
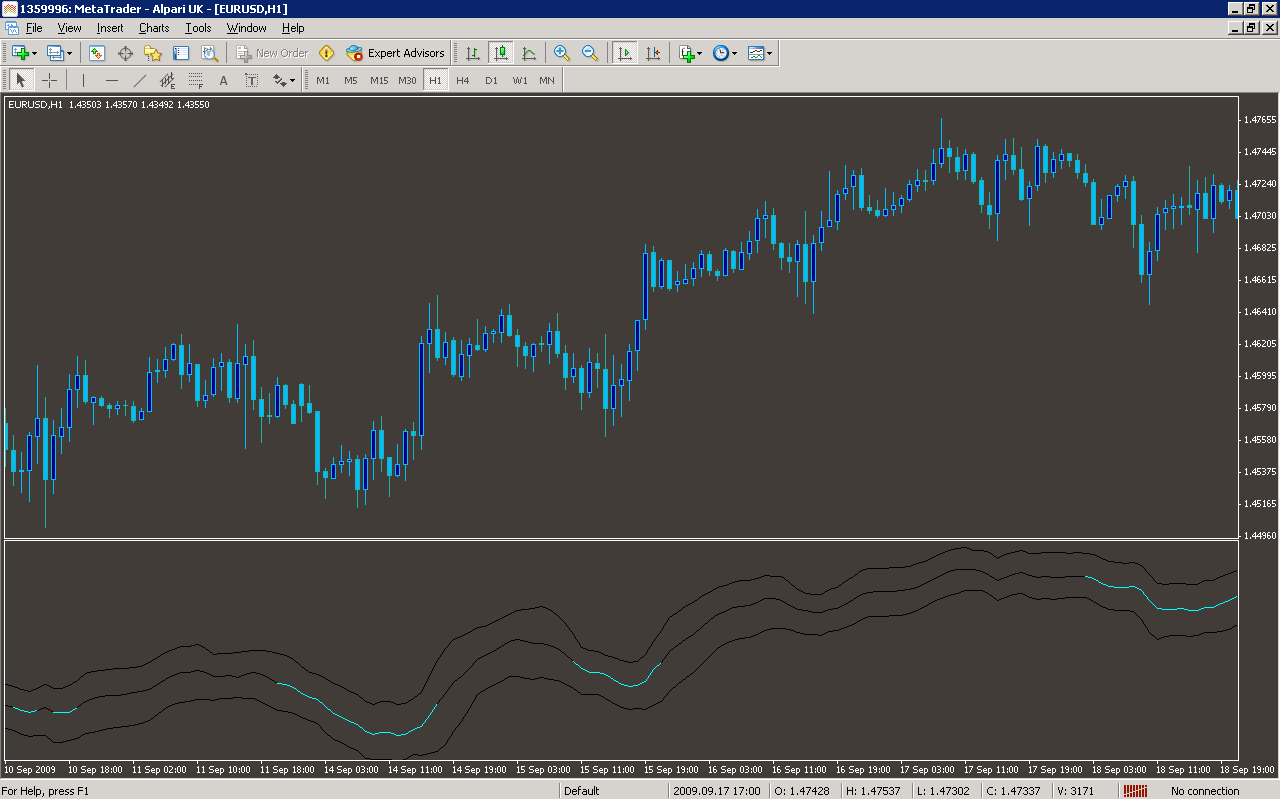
Analysis
Market Information Used:
Series array that contains close prices for each bar
Series array that contains the highest prices of each bar
Series array that contains the lowest prices of each bar
Indicator Curves created:
Implements a curve of type DRAW_LINE
Indicators Used:
Custom Indicators Used:
Order Management characteristics:
Other Features: