#property indicator_chart_window
#property indicator_buffers 3
#property indicator_color1 SpringGreen
#property indicator_color2 OrangeRed
#property indicator_color3 White
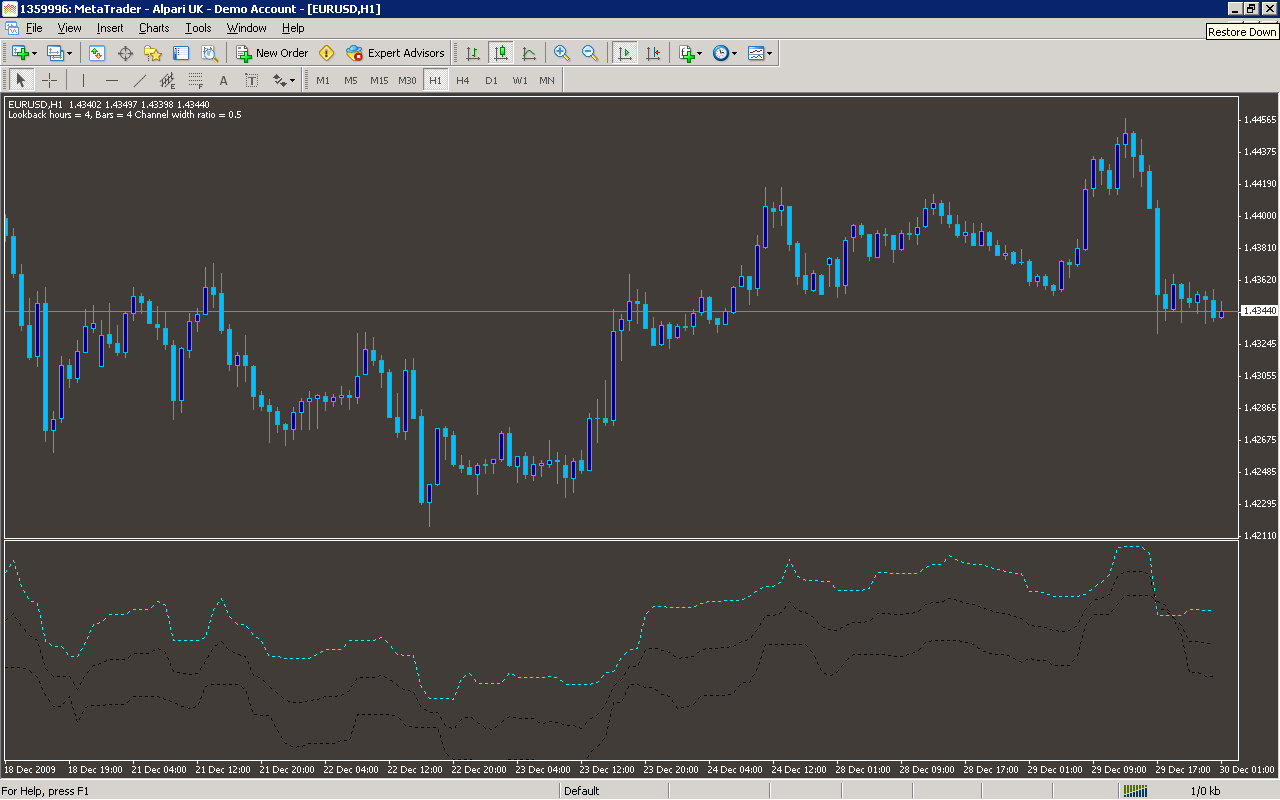
extern double ChannelWidth=0.5;
extern double HoursLookBack=4.0;
double RangeUP[], RangeDOWN[], AvRange[];
double RangeFactor=0;
int currday,cnt,lookback;
double TodaysLow;
double TodaysHigh;
int init()
{
lookback = (HoursLookBack*60)/Period();
SetIndexStyle(0,DRAW_LINE,STYLE_DOT);
SetIndexBuffer(0,RangeUP);
SetIndexStyle(1,DRAW_LINE,STYLE_DOT);
SetIndexBuffer(1,RangeDOWN);
SetIndexStyle(2,DRAW_LINE,STYLE_DOT);
SetIndexBuffer(2,AvRange);
IndicatorDigits(MarketInfo(Symbol(),MODE_DIGITS));
}
//+------------------------------------------------------------------+
//| expert deinitialization function |
//+------------------------------------------------------------------+
int deinit()
{
//----
//----
return(0);
}
//+------------------------------------------------------------------+
//| expert start function |
//+------------------------------------------------------------------+
int start()
{
Comment("Lookback hours = ",HoursLookBack,", Bars = ",lookback, " Channel width ratio = ",ChannelWidth);
int counted_bars = IndicatorCounted();
if(counted_bars < 0)
return(-1);
if(counted_bars > 0)
counted_bars--;
int limit = Bars - counted_bars-200;
for(cnt = 0; cnt < limit ; cnt++)
{
currday=MathFloor(cnt*Period()/1440);
//if(TimeDay(Time[cnt]) != TimeDay(Time[cnt+1]))
//{
double Range1=Range(1);
double Range5=Range(5);
double Range10=Range(10);
double Range20=Range(20);
double AverageRange=(Range1+Range5+Range10+Range20)/4;
RangeFactor=AverageRange*ChannelWidth;
RangeFactor=NormalizeDouble(RangeFactor,Digits);
//}
TodaysLow=Low[iLowest(NULL,0,MODE_LOW,lookback,cnt)];
TodaysHigh=High[iHighest(NULL,0,MODE_HIGH,lookback,cnt)];
RangeUP[cnt] = TodaysLow + RangeFactor;
RangeDOWN[cnt] = TodaysHigh - RangeFactor;
AvRange[cnt] = ((TodaysLow + RangeFactor)+(TodaysHigh - RangeFactor))/2;
}
}
//+------------------------------------------------------------------+
double Range (int Days)
{
double DailyHigh,DailyLow,DailyRange,TotalRange,AR=0;
for (int i=1;i<=Days;i++)
{
int WeekDay=TimeDayOfWeek(iTime(NULL, PERIOD_D1,i+currday));
if (WeekDay != 0 || WeekDay != 6)
{
DailyHigh=iHigh(Symbol(),PERIOD_D1,i+currday);
DailyLow=iLow(Symbol(),PERIOD_D1,i+currday);
DailyRange=(DailyHigh-DailyLow);
TotalRange=TotalRange+DailyRange;
}
else
{
Days=Days+1;
}
}
AR=TotalRange/Days;
AR=NormalizeDouble(AR,Digits);
return(AR);
}
Sample
Analysis
Market Information Used:
Series array that contains the lowest prices of each bar
Series array that contains the highest prices of each bar
Indicator Curves created:
Implements a curve of type DRAW_LINE
Indicators Used:
Custom Indicators Used:
Order Management characteristics:
Other Features: