//+------------------------------------------------------------------+
//|                                                                  |
//|                       "Copyright © 2005, DriverDan"              |
//|                             superfunman2000@yahoo.com            |
//+------------------------------------------------------------------+
/*
 * Filename:    VSI.mq4
 * Author:      DriverDan
 * Date:        Oct 20, 2005
 *
 * Description: Indicator that calculates volume per second (or period) and the corresponding MA.
 *              Uses volume per second since it will be uniform for all chart periods.
 *              Indicator seems to work best on 15m to 4h charts. IMHO, 1m and 5m periods are
 *              too short for valid results and 1d+ will show low periods for partial days on MT4.
 *
 * Version:     1.0
 *              Initial release
 */

#property copyright         "Copyright © 2005, DriverDan"
#property link              "superfunman2000@yahoo.com"
//----
#property indicator_separate_window
#property indicator_minimum 0
#property indicator_buffers 2
#property indicator_color1  DodgerBlue
#property indicator_color2  Red
//----
#define    SECINMIN         60  //Number of seconds in a minute
//----
extern int vsiMAPeriod   =7;  //Period for the moving average.
extern int vsiMAType     =1;  //Moving average type. 0 = SMA, 1 = EMA, 2 = SMMA, 3 = LWMA
extern int showPerPeriod =0;  //0 = volume per second, 1 = volume per chart period
                                /* Volume per second allows you to compare values for different
                                   chart periods. Otherwise the values it will show will only be
                                   valid for the chart period you are viewing. The graph will
                                   look exactly the same but the values will be different. */
double vsiBuffer[];
double vsiMABuffer[];
//+------------------------------------------------------------------+
//|                                                                  |
//+------------------------------------------------------------------+
  int init()
  {
   string vsiTitle="VSI(" + vsiMAPeriod + ")";
   SetIndexStyle(0,DRAW_LINE);
   SetIndexStyle(1,DRAW_LINE);
   SetIndexBuffer(0, vsiBuffer);
   SetIndexBuffer(1, vsiMABuffer);
   IndicatorShortName(vsiTitle);
   SetIndexLabel(0, vsiTitle);
   SetIndexLabel(1, "vsiMA(" + vsiMAPeriod + ")");
   SetIndexDrawBegin(1, vsiMAPeriod);
   return(0);
  }
//+------------------------------------------------------------------+
//|                                                                  |
//+------------------------------------------------------------------+
  int start()
  {
   int i, limit, timeDiff;
   int counted_bars=IndicatorCounted();
     if(counted_bars>=0)
     {
      //If counted bars is greater than zero we must subtract 1 so we get in the right position
        if(counted_bars > 0)
        {
         counted_bars--;
        }
      //Only count bars we haven't already drawn
      limit=Bars - counted_bars;
//----
        for(i=0; i < limit; i++)
        {
         //Difference between the current time and the bar start
         timeDiff=CurTime() - Time[i];
         //If we are in the current bar and the tick doesn't fall exactly on the '00:00' min & sec
           if(i==0 && timeDiff > 0)
           {
            vsiBuffer[i]=Volume[i]/timeDiff;
            }
             else
            {
            //Otherwise calculate the total bar volume divided by the total bar seconds
            vsiBuffer[i]=Volume[i]/(Time[i - 1] - Time[i]);
           }
           if(showPerPeriod==1)
           {
            vsiBuffer[i]=vsiBuffer[i] * Period() * SECINMIN;
           }
        }
      //Fill the moving average buffer
        for(i=0; i < limit; i++)
        {
         vsiMABuffer[i]=iMAOnArray(vsiBuffer, Bars, vsiMAPeriod, 0, vsiMAType, i);
        }
     }
   return(0);
  }
//+------------------------------------------------------------------+
Sample
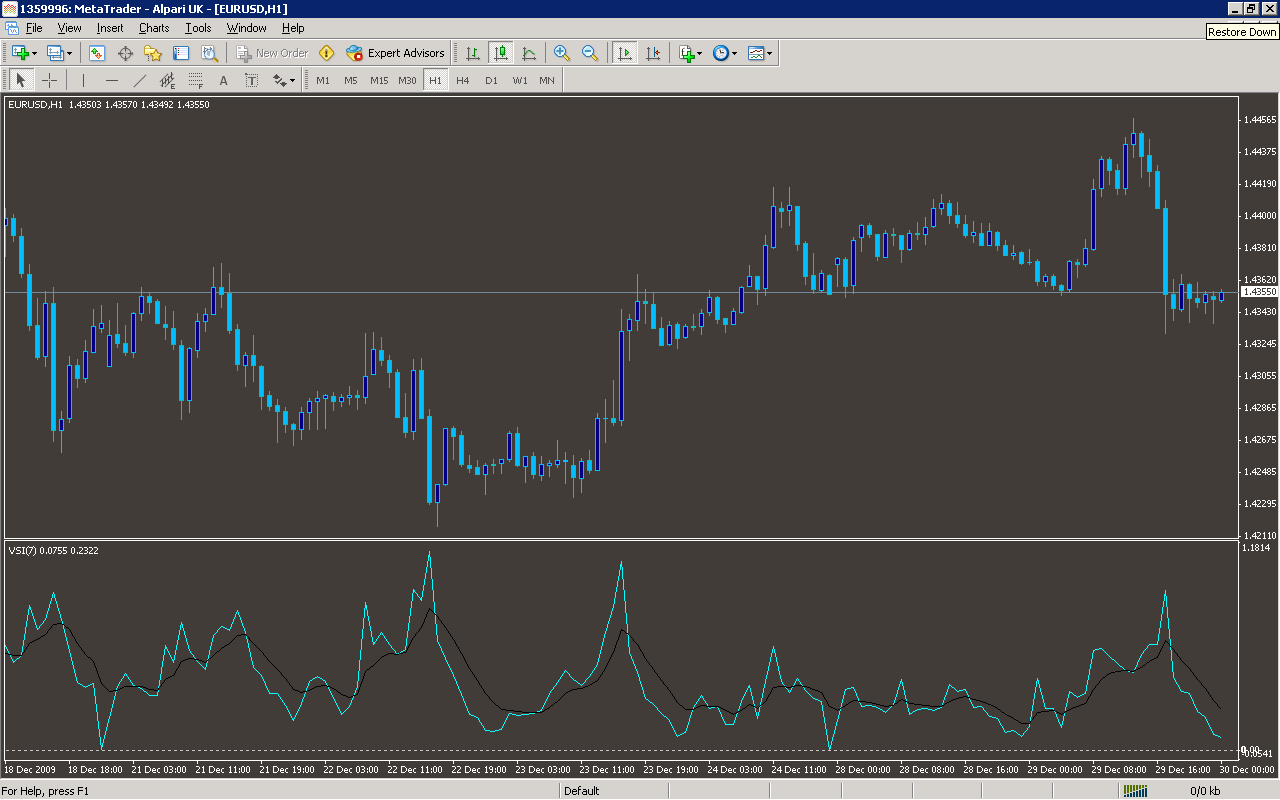
Analysis
Market Information Used:
Series array that contains open time of each bar
Series array that contains tick volumes of each bar
Indicator Curves created:
Implements a curve of type DRAW_LINE
Indicators Used:
Moving average indicator
Custom Indicators Used:
Order Management characteristics:
Other Features: