#property indicator_chart_window
#property indicator_buffers 4
#property indicator_color1 Black
#property indicator_color2 Black
#property indicator_color3 Green
#property indicator_color4 Red

extern int ChannelPeriod=28;
extern int EMAPeriod=120;
extern int StartEMAShift=6;
extern int EndEMAShift=0;
extern double AngleTreshold=0.32;

double UpperLine[];
double LowerLine[];
double BuyBuffer[];
double SellBuffer[];

int init()
  {
   SetIndexStyle(0,DRAW_LINE);
   SetIndexBuffer(0,UpperLine);
   SetIndexLabel(0,"UpperLine");

   SetIndexStyle(1,DRAW_LINE);
   SetIndexBuffer(1,LowerLine);
   SetIndexLabel(1,"LowerLine");

   SetIndexStyle(2,DRAW_ARROW,EMPTY);
   SetIndexArrow(2,241);
   SetIndexBuffer(2,BuyBuffer);
   SetIndexLabel(2,"Buy");

   SetIndexStyle(3,DRAW_ARROW,EMPTY);
   SetIndexArrow(3,242);
   SetIndexBuffer(3,SellBuffer);
   SetIndexLabel(3,"Sell");

   IndicatorShortName("DonchianChannel("+ChannelPeriod+")");
   SetIndexDrawBegin(0,ChannelPeriod);
   SetIndexDrawBegin(1,ChannelPeriod);
   return(0);
  }
//+------------------------------------------------------------------+
//| Price Channel                                                         |
//+------------------------------------------------------------------+
int start()
  {
   int i, start ,counted_bars=IndicatorCounted();
   int    k;
   double high,low,price, fEndMA, fStartMA, fAngle;

   if(Bars<=ChannelPeriod) return(0);

   if(counted_bars>=ChannelPeriod) {
      start=Bars-counted_bars-1;
   } else {
      start=Bars-ChannelPeriod-1;
   }

   BuyBuffer[0]=0;
   SellBuffer[0]=0;

   for(i=start;i>=0;i--) {
      UpperLine[i]=High[Highest(NULL, 0, MODE_HIGH, ChannelPeriod, i)];
      LowerLine[i]=Low[Lowest(NULL, 0, MODE_LOW, ChannelPeriod, i)];

      // next 3 lines from jpkfox, EMAAngle.mq4
      fEndMA=iMA(NULL,0,EMAPeriod,0,MODE_EMA,PRICE_MEDIAN,i+EndEMAShift);
      fStartMA=iMA(NULL,0,EMAPeriod,0,MODE_EMA,PRICE_MEDIAN,i+StartEMAShift);
      fAngle = 10000.0 * (fEndMA - fStartMA)/(StartEMAShift-EndEMAShift);


      if(UpperLine[i+1]<High[i] && fAngle > AngleTreshold) {
         BuyBuffer[i]=High[i];
      }
      if(LowerLine[i+1]>Low[i] && fAngle < -AngleTreshold) {
         SellBuffer[i]=Low[i];
      }

      if (BuyBuffer[0]!=0) {
         Print("Donchian Buy Signal at " + BuyBuffer[0] + " -> " + Symbol() + "/" + Period());
         // PlaySound("expert.wav");
      }

      if (SellBuffer[0]!=0) {
         Print("Donchian Sell Signal at " + SellBuffer[0] + " -> " + Symbol() + "/" + Period());
         // PlaySound("expert.wav");
      }

   }
  }
//+------------------------------------------------------------------+
Sample
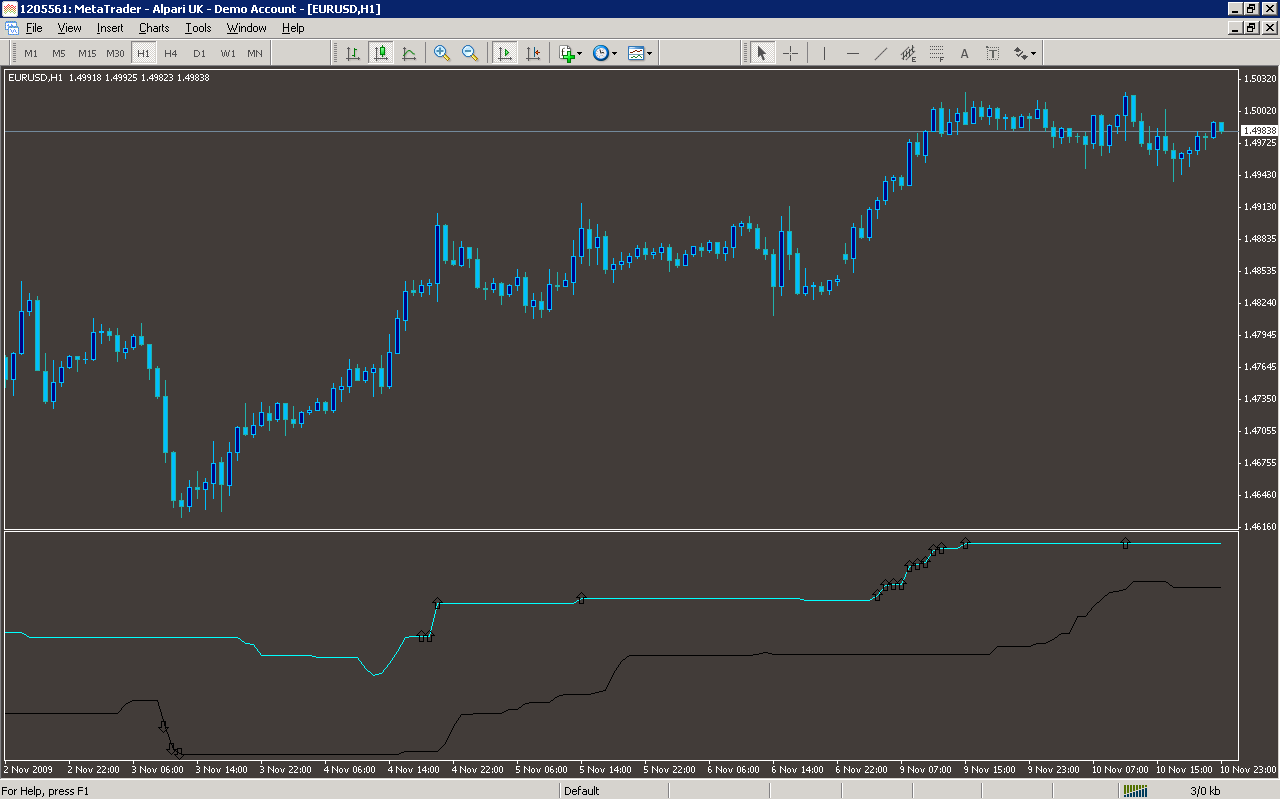
Analysis
Market Information Used:
Series array that contains the highest prices of each bar
Series array that contains the lowest prices of each bar
Indicator Curves created:
Implements a curve of type DRAW_LINE
Implements a curve of type DRAW_ARROW
Indicators Used:
Moving average indicator
Custom Indicators Used:
Order Management characteristics:
Other Features: