/*-----------------------------+
|			       |
| Shared by www.Aptrafx.com    |
|			       |
+------------------------------*/

//+------------------------------------------------------------------+
//|                                                    Wiseman 1.mq4 |
//|                           Bill Williams Wiseman 1 Divergent bars |
//|                                             Author: David Thomas |
//|                                      MQ4 Conversion: Pavel Kulko |
//|                                                  polk@alba.dp.ua |
//+------------------------------------------------------------------+
#property copyright "Copyright © 2005, Pavel Kulko"
#property link      "polk@alba.dp.ua"

#property indicator_chart_window
#property indicator_buffers 2
#property indicator_color1 Aqua
#property indicator_color2 Red

double UpBuf[],DnBuf[];
//+------------------------------------------------------------------+
//| Custom indicator initialization function                         |
//+------------------------------------------------------------------+
int init() {
   SetIndexStyle(0,DRAW_HISTOGRAM,0,2);
   SetIndexBuffer(0,UpBuf);
   SetIndexStyle(1,DRAW_HISTOGRAM,0,2);
   SetIndexBuffer(1,DnBuf);
   return(0);
}
//+------------------------------------------------------------------+
//| Custom indicator iteration function                              |
//+------------------------------------------------------------------+
int start() {
   int result;
   double median;
   int    counted_bars=IndicatorCounted();
   int limit = Bars-counted_bars-1;
   for(int i=limit; i>=0; i--) {
     result = 0;
     median = (High[i]+Low[i])/2;
     if((Low[i] < Low[i+1]) && (Close[i] > median)) result = -1;
     if((High[i] > High[i+1]) && (Close[i] < median)) result = 1;
     if(result > 0) {
       UpBuf[i] = Low[i];
       DnBuf[i] = High[i];
     }
     if(result < 0) {
       UpBuf[i] = High[i];
       DnBuf[i] = Low[i];
     }
   }
   return(0);
}
//+------------------------------------------------------------------+
Sample
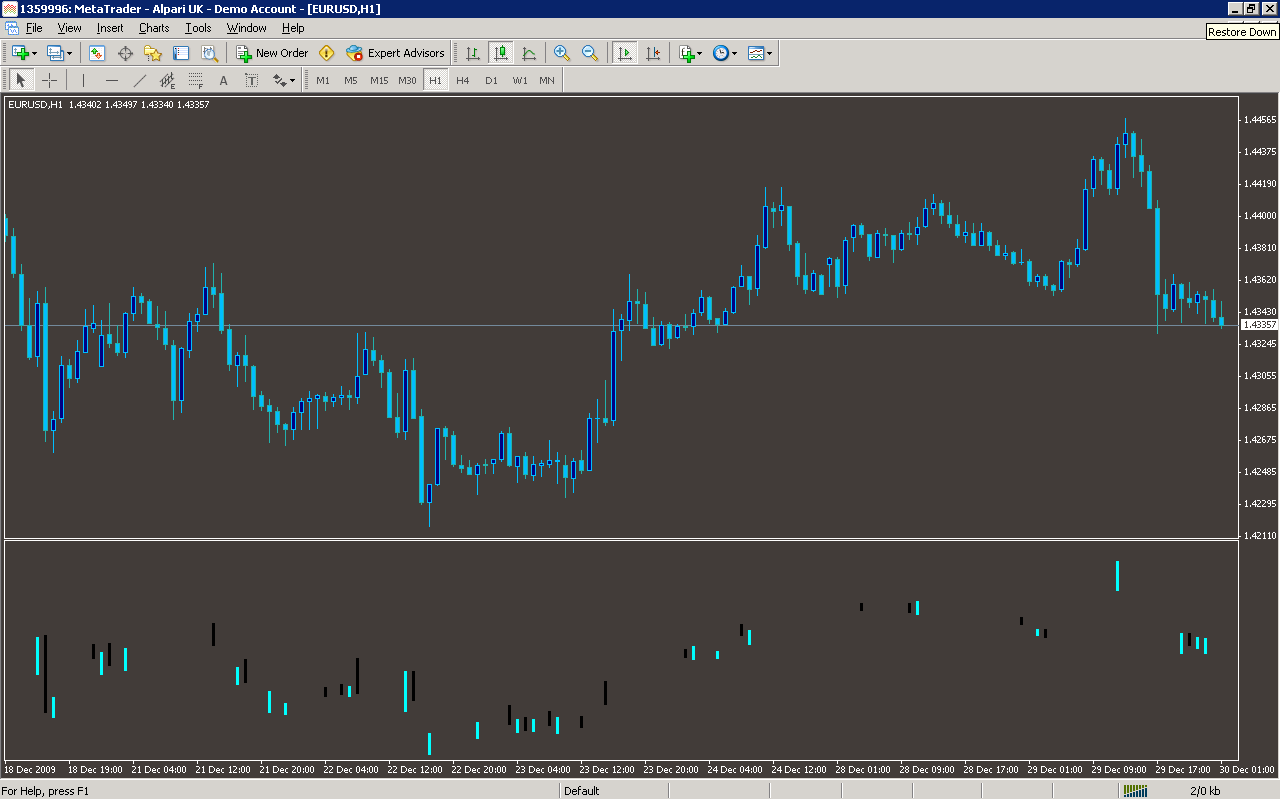
Analysis
Market Information Used:
Series array that contains the highest prices of each bar
Series array that contains the lowest prices of each bar
Series array that contains close prices for each bar
Indicator Curves created:
Implements a curve of type DRAW_HISTOGRAM
Indicators Used:
Custom Indicators Used:
Order Management characteristics:
Other Features: