//+------------------------------------------------------------------+
//|                                      Williams’ Percent Range.mq4 |
//|                                       Copyright © 2009, Ulterior |
//+------------------------------------------------------------------+
#property copyright "Copyright © 2005, MetaQuotes Software Corp."
#property link      "http://www.metaquotes.net/"
//----
#property indicator_separate_window
#property indicator_minimum -55
#property indicator_maximum 55
#property indicator_buffers 4
#property indicator_color1 DodgerBlue
#property indicator_color2 DodgerBlue
#property indicator_color3 DarkGreen
#property indicator_color4 FireBrick
#property indicator_width1 3
#property indicator_width2 3
#property indicator_width3 3
#property indicator_width4 3

#property indicator_level1 0
#property indicator_level2 40
#property indicator_level3 -40
#property indicator_levelcolor Black
//---- input parameters
extern int ExtWPRPeriod = 30;
//---- buffers
double ExtWPRBuffer1[];
double ExtWPRBuffer2[];
double ExtWPRLongBuffer1[];
double ExtWPRShortBuffer1[];
//+------------------------------------------------------------------+
//| Custom indicator initialization function                         |
//+------------------------------------------------------------------+
int init()
  {
   string sShortName;
//---- indicator buffer mapping
   SetIndexBuffer(0, ExtWPRBuffer1);
   SetIndexBuffer(1, ExtWPRBuffer2);
   SetIndexBuffer(2, ExtWPRLongBuffer1);
   SetIndexBuffer(3, ExtWPRShortBuffer1);
//---- indicator line
   SetIndexStyle(0, DRAW_HISTOGRAM);
   SetIndexStyle(1, DRAW_HISTOGRAM);
   SetIndexStyle(2, DRAW_HISTOGRAM);
   SetIndexStyle(3, DRAW_HISTOGRAM);
//---- name for DataWindow and indicator subwindow label
   sShortName="%Rhist(" + ExtWPRPeriod + ")";
   IndicatorShortName(sShortName);
   SetIndexLabel(0, StringConcatenate(sShortName, "up" ));
   SetIndexLabel(1, StringConcatenate(sShortName, "down" ));
   SetIndexLabel(2, StringConcatenate(sShortName, "long" ));
   SetIndexLabel(3, StringConcatenate(sShortName, "short" ));
//---- first values aren't drawn
   SetIndexDrawBegin(0, ExtWPRPeriod);
   SetIndexDrawBegin(1, ExtWPRPeriod);
   SetIndexDrawBegin(2, ExtWPRPeriod);
   SetIndexDrawBegin(3, ExtWPRPeriod);
//----
   return(0);
  }
//+------------------------------------------------------------------+
//| Williams’ Percent Range                                          |
//+------------------------------------------------------------------+
int start()
  {
   int i, nLimit, nCountedBars;
//---- insufficient data
   if(Bars <= ExtWPRPeriod)
       return(0);
//---- bars count that does not changed after last indicator launch.
   nCountedBars = IndicatorCounted();
//----Williams’ Percent Range calculation
   i = Bars - ExtWPRPeriod - 1;
   if(nCountedBars > ExtWPRPeriod)
       i = Bars - nCountedBars - 1;

   double upperShadow, lowerShadow, body;

   while(i >= 0)
     {
       double dMaxHigh = High[Highest(NULL, 0, MODE_HIGH, ExtWPRPeriod, i)];
       double dMinLow = Low[Lowest(NULL, 0, MODE_LOW, ExtWPRPeriod, i)];
       if(!CompareDouble((dMaxHigh - dMinLow), 0.0))
       {
           double val = 100*(dMaxHigh - Close[i]) / (dMaxHigh - dMinLow);

           ExtWPRLongBuffer1[i] = 0;

           if( val <= 50 ) { ExtWPRBuffer1[i] = -val+50; ExtWPRBuffer2[i] = 0; } else { ExtWPRBuffer1[i] = 0; ExtWPRBuffer2[i] = -val+50; }

           if(Close[i]<=Open[i] )
           {
            lowerShadow = Close[i]-Low[i];
            upperShadow = High[i]-Open[i];
            body = Open[i]-Close[i];
           }

           if(Close[i]>=Open[i] )
           {
            lowerShadow = Open[i]-Low[i];
            upperShadow = High[i]-Close[i];
            body = Close[i]-Open[i];
           }

           if( (ExtWPRBuffer2[i+1] < ExtWPRBuffer2[i]) && (Low[i] <= dMinLow) && ((Low[i] < Low[i+1]) || (Close[i] > Open[i])) && (lowerShadow >= 0)  )
           {
            ExtWPRLongBuffer1[i] = ExtWPRBuffer2[i];
           }
           else
           if( (ExtWPRBuffer1[i+1] > ExtWPRBuffer1[i]) && (High[i] >= dMaxHigh) && (High[i] > High[i+1]) && (upperShadow >= 0) )
           {
            ExtWPRShortBuffer1[i] = ExtWPRBuffer1[i];
           }
           else
           {
            ExtWPRLongBuffer1[i] = 0;
            ExtWPRShortBuffer1[i] = 0;
           }
       }
       i--;
     }
//----
   return(0);
  }
//+------------------------------------------------------------------+
//| Ôóíêöèÿ ñðàíåíèÿ äâóõ âåùåñòâåííûõ ÷èñåë.                        |
//+------------------------------------------------------------------+
bool CompareDouble(double Number1, double Number2)
  {
    bool Compare = NormalizeDouble(Number1 - Number2, 8) == 0;
    return(Compare);
  }
//+------------------------------------------------------------------+
Sample
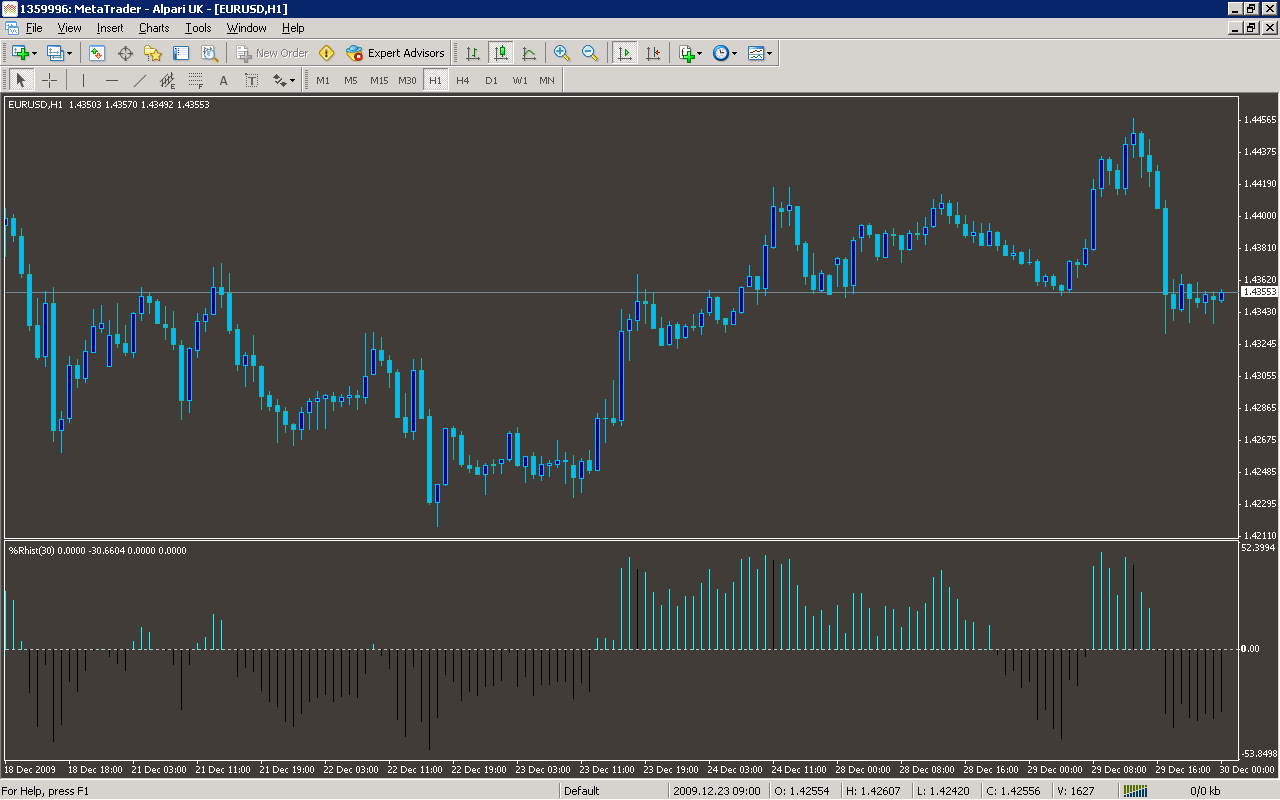
Analysis
Market Information Used:
Series array that contains the highest prices of each bar
Series array that contains the lowest prices of each bar
Series array that contains close prices for each bar
Series array that contains open prices of each bar
Indicator Curves created:
Implements a curve of type DRAW_HISTOGRAM
Indicators Used:
Custom Indicators Used:
Order Management characteristics:
Other Features: