//+------------------------------------------------------------------+
//|                                                      WPRslow.mq4 |
//|                                        Ramdass - Conversion only |
//+------------------------------------------------------------------+
#property  copyright "Author - OlegVS"
//----
#property indicator_separate_window
#property indicator_minimum -1.0
#property indicator_maximum  1.0
#property indicator_buffers 2
#property indicator_color1 Blue
#property indicator_color2 Red
//---- input parameters
extern int P = 54;
extern int n1 = 9;
extern int n2 = 49;
extern int CountBars = 300;
//---- buffers
double Up[];
double Down[];
//+------------------------------------------------------------------+
//| Custom indicator initialization function                         |
//+------------------------------------------------------------------+
int init()
  {
//---- indicator line
   IndicatorBuffers(2);
   SetIndexStyle(0, DRAW_HISTOGRAM, STYLE_SOLID, 2);
   SetIndexStyle(1, DRAW_HISTOGRAM, STYLE_SOLID, 2);
   SetIndexBuffer(0, Up);
   SetIndexBuffer(1, Down);
//---- name for DataWindow and indicator subwindow label
   IndicatorShortName("WPRslow(" + P + ", " + n1 + ", " + n2 + ")");
   SetIndexLabel(0, "WPRslowUp(" + P + ", " + n1 + ", " + n2 + ")");
   SetIndexLabel(1, "WPRslowDown(" + P + ", " + n1 + ", " + n2 + ")");
//----
   if(CountBars > Bars)
       CountBars = Bars;
   SetIndexDrawBegin(0, Bars - CountBars + P);
   SetIndexDrawBegin(1, Bars - CountBars + P);
//----
   return(0);
  }
//+------------------------------------------------------------------+
//| WPRslow                                                          |
//+------------------------------------------------------------------+
int start()
  {
   int i, counted_bars = IndicatorCounted();
   double V1, V2;
//----
   if(CountBars <= P)
       return(0);
//---- initial zero
   if(counted_bars < 1)
     {
       for(i = 1; i <= P; i++)
           Up[CountBars-i] = 0.0;
       for(i = 1; i <= P; i++)
           Down[CountBars-i] = 0.0;
     }
//----
   i = CountBars - P - 1;
   while(i >= 0)
     {
       Down[i] = 0.0;
       Up[i] = 0.0;
       V1 = iWPR(NULL, 0, P, i)*iWPR(NULL, 0, P, i) / 100;
       V2 = MathCeil(V1);
       if(V2 < n1)
         {
           Up[i] = V2;
         }
       if(V2 > n2)
         {
           Down[i] = -(V2);
         }
       i--;
     }
   return(0);
  }
//+------------------------------------------------------------------+
Sample
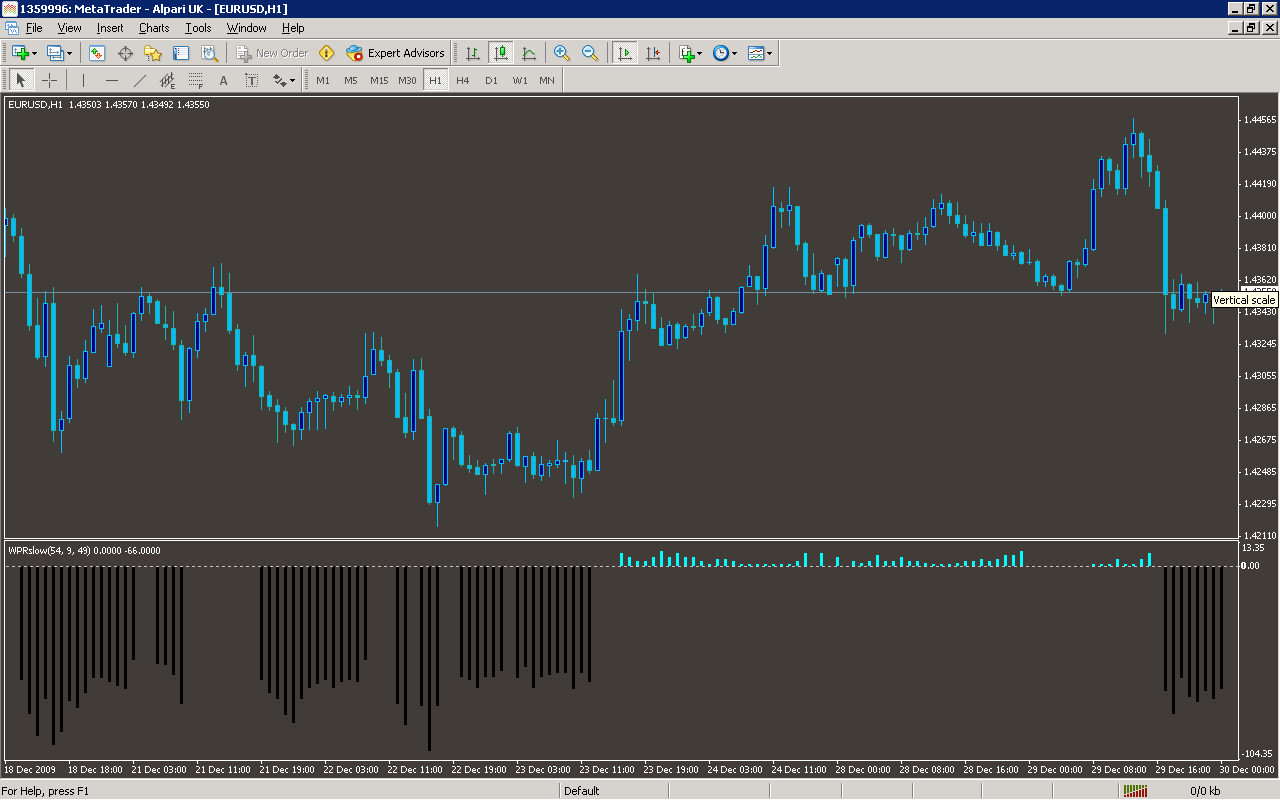
Analysis
Market Information Used:
Indicator Curves created:
Implements a curve of type DRAW_HISTOGRAM
Indicators Used:
Larry William percent range indicator
Custom Indicators Used:
Order Management characteristics:
Other Features: