//+------------------------------------------------------------------+
//|                                          ZeroLag Stochs_true.mq4 |
//|                      Copyright © 2004, MetaQuotes Software Corp. |
//|                                       http://www.metaquotes.net/ |
//+------------------------------------------------------------------+
#property copyright "Copyright © 2004, MetaQuotes Software Corp."
#property link      "http://www.metaquotes.net/"
#include <stdlib.mqh>
//----
#property indicator_separate_window
//#property indicator_minimum 0
//#property indicator_maximum 100
#property indicator_buffers 2
#property indicator_color1 Blue
#property indicator_color2 Red
//---- input parameters
extern int KPeriod = 5;
extern int Slowing = 3;
extern int DPeriod = 3;
//---- buffers
double MainBuffer[];
double SignalBuffer[];
double HighesBuffer[];
double LowesBuffer[];
double WorkBuffer[];
double WorkBuffer2[];
//----
int draw_begin1 = 0;
int draw_begin2 = 0;
//+------------------------------------------------------------------+
//| Custom indicator initialization function                         |
//+------------------------------------------------------------------+
int init()
  {
   string short_name;
//---- 2 additional buffers are used for counting.
   IndicatorBuffers(6);
   SetIndexBuffer(2, HighesBuffer);
   SetIndexBuffer(3, LowesBuffer);
   SetIndexBuffer(4, WorkBuffer);
   SetIndexBuffer(5, WorkBuffer2);
//---- indicator lines
   SetIndexStyle(0, DRAW_LINE);
   SetIndexBuffer(0, MainBuffer);
   SetIndexStyle(1, DRAW_LINE);
   SetIndexBuffer(1, SignalBuffer);
//---- name for DataWindow and indicator subwindow label
   short_name="ZLStoch(" + KPeriod + "," + DPeriod + "," + Slowing + ")";
   IndicatorShortName(short_name);
   SetIndexLabel(0, short_name);
   SetIndexLabel(1, "Signal");
//----
   draw_begin1 = KPeriod + Slowing;
   draw_begin2 = draw_begin1 + DPeriod;
   SetIndexDrawBegin(0, draw_begin1);
   SetIndexDrawBegin(1, draw_begin2);
//----
   return(0);
  }
//+------------------------------------------------------------------+
//| Stochastic oscillator                                            |
//+------------------------------------------------------------------+
int start()
  {
   int    i, k;
   int    counted_bars = IndicatorCounted();
   double price, EMA;
//----
   if(Bars <= draw_begin2)
       return(0);
//---- initial zero
   if(counted_bars < 1)
     {
       for(i = 1; i <= draw_begin1; i++)
           MainBuffer[Bars-i] = 0;
       for(i = 1; i <= draw_begin2; i++)
           SignalBuffer[Bars-i] = 0;
     }
//---- minimums counting
   i = Bars - KPeriod;
   if(counted_bars > KPeriod)
       i = Bars - counted_bars - 1;
   while(i >= 0)
     {
       double min = 1000000;
       k = i + KPeriod - 1;
       while(k >= i)
         {
           price = Low[k];
           if(min > price)
               min = price;
           k--;
         }
       LowesBuffer[i] = min;
       i--;
     }
//---- maximums counting
   i = Bars - KPeriod;
   if(counted_bars > KPeriod)
       i = Bars - counted_bars - 1;
   while(i >= 0)
     {
       double max=-1000000;
       k = i + KPeriod - 1;
       while(k >= i)
         {
           price = High[k];
           if(max < price)
               max = price;
           k--;
         }
       HighesBuffer[i] = max;
       i--;
     }
//---- %K line
   i = Bars - draw_begin1;
   if(counted_bars > draw_begin1)
       i = Bars - counted_bars - 1;
   while(i >= 0)
     {
       if(!CompareDouble((HighesBuffer[i] - LowesBuffer[i]), 0.0))
           WorkBuffer[i] = 100*((Close[i] - LowesBuffer[i]) / (HighesBuffer[i] - LowesBuffer[i]));
       i--;
     }
//---- last counted bar will be recounted
   if(counted_bars > 0)
       counted_bars--;
   int limit = Bars - counted_bars;
//---- main line is simple movimg average
   for(i = 0; i < limit; i++)
       WorkBuffer2[i] = iMAOnArray(WorkBuffer, Bars, Slowing, 0, MODE_SMA, i);
   for(i = 0; i < limit; i++)
     {
       EMA = iMAOnArray(WorkBuffer2, Bars, Slowing, 0, MODE_SMA, i);
       MainBuffer[i] = WorkBuffer2[i] + WorkBuffer2[i] - EMA;
     }
//---- signal line is simple movimg average
   for(i = 0; i < limit; i++)
       WorkBuffer2[i] = iMAOnArray(MainBuffer, Bars, DPeriod, 0, MODE_SMA, i);
   for(i = 0; i < limit; i++)
     {
       EMA = iMAOnArray(WorkBuffer2, Bars, DPeriod, 0, MODE_SMA, i);
       SignalBuffer[i] = WorkBuffer2[i] + WorkBuffer2[i] - EMA;
     }
//----
   return(0);
  }
//+------------------------------------------------------------------+
//| Ôóíêöèÿ ñðàíåíèÿ äâóõ âåùåñòâåííûõ ÷èñåë.                        |
//+------------------------------------------------------------------+
bool CompareDouble (double Number1, double Number2)
  {
    bool Compare = NormalizeDouble(Number1 - Number2, 8) == 0;
    return(Compare);
  }
//+------------------------------------------------------------------+
Sample
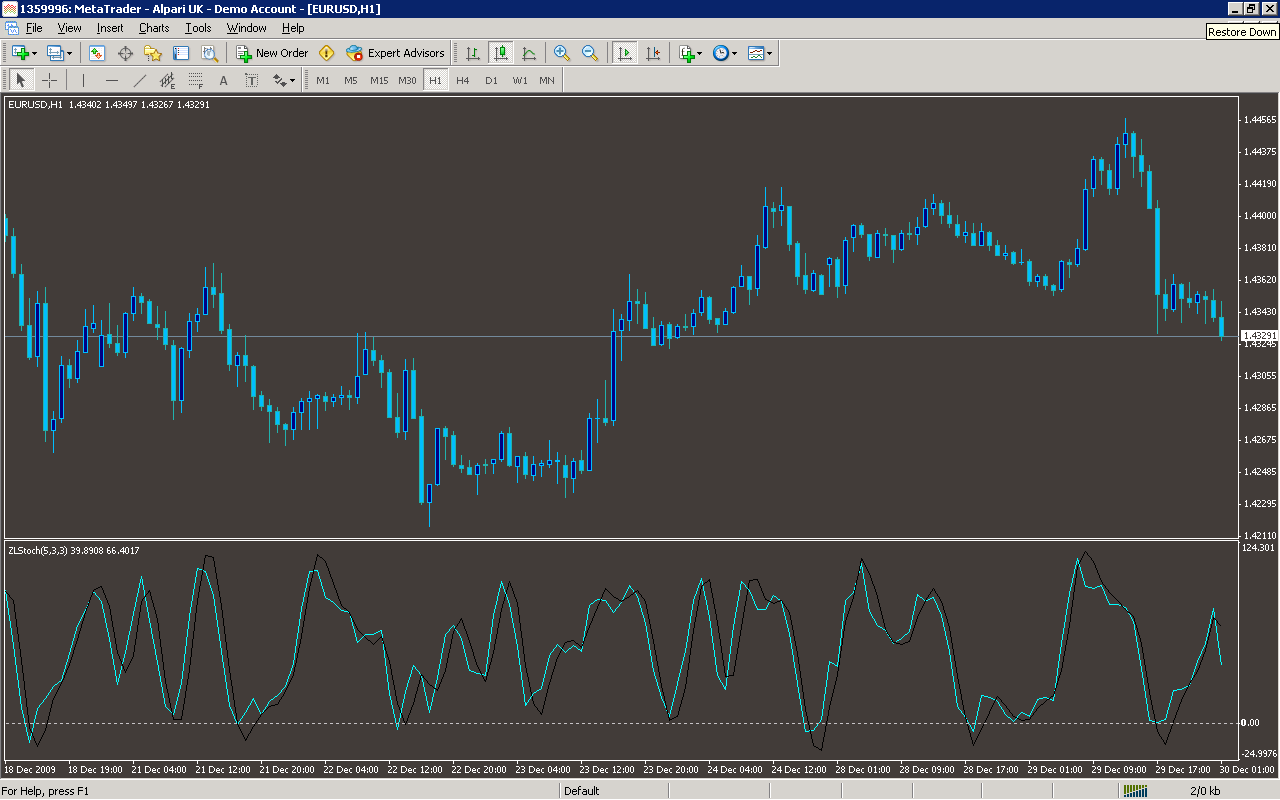
Analysis
Market Information Used:
Series array that contains the lowest prices of each bar
Series array that contains the highest prices of each bar
Series array that contains close prices for each bar
Indicator Curves created:
Implements a curve of type DRAW_LINE
Indicators Used:
Moving average indicator
Custom Indicators Used:
Order Management characteristics:
Other Features: