//+------------------------------------------------------------------+
//|                                                 DSS Bressert.mq4 |
//|                      Copyright © 2008, MetaQuotes Software Corp. |
//|                                       http://www.metaquotes.net/ |
//+------------------------------------------------------------------+
#property copyright "Copyright © 2008, MetaQuotes Software Corp."
#property link      "http://www.metaquotes.net/"

#property indicator_separate_window
#property indicator_minimum 0
#property indicator_maximum 100
#property indicator_buffers 2
#property indicator_color1 Red
#property indicator_color2 DarkBlue
#property indicator_level1 20
#property indicator_level2 80

//---- input parameters
extern int       EMA_period=8;
extern int       Stochastic_period=13;
//---- buffers
double DssBuffer[];
double MitBuffer[];

double smooth_coefficient;
//+------------------------------------------------------------------+
//| Custom indicator initialization function                         |
//+------------------------------------------------------------------+
int init()
  {
//---- indicators
   SetIndexStyle(0,DRAW_LINE);
   SetIndexBuffer(0,DssBuffer);
   SetIndexStyle(1,DRAW_LINE);
   SetIndexBuffer(1,MitBuffer);

   SetIndexEmptyValue(0, 0.0);
   SetIndexLabel(0, "DSS");
   SetIndexEmptyValue(1, 0.0);
   SetIndexLabel(1, "MIT");

   IndicatorShortName ("DSS("+EMA_period+","+Stochastic_period+")");

   smooth_coefficient = 2.0 / (1.0 + EMA_period);
//----
   return(0);
  }
//+------------------------------------------------------------------+
//| Custom indicator deinitialization function                       |
//+------------------------------------------------------------------+
int deinit()
  {
//----

//----
   return(0);
  }
//+------------------------------------------------------------------+
//| Custom indicator iteration function                              |
//+------------------------------------------------------------------+
int start()
  {
   int i, limit, counted_bars=IndicatorCounted();
//----
   if (counted_bars == 0)   limit = Bars - Stochastic_period;
   if (counted_bars > 0)   limit = Bars - counted_bars;

   double HighRange, LowRange;
   double delta, MIT;
   for (i = limit; i >= 0; i--)
      {
      HighRange = High[iHighest(NULL,0,MODE_HIGH,Stochastic_period,i)];
      LowRange = Low[iLowest(NULL,0,MODE_LOW,Stochastic_period,i)];
      delta = Close[i] - LowRange;
      MIT = delta/(HighRange - LowRange)*100.0;
      MitBuffer[i] = smooth_coefficient * (MIT - MitBuffer[i+1]) + MitBuffer[i+1];
      }

   double DSS;
   for (i = limit; i >= 0; i--)
      {
      HighRange = MitBuffer[ArrayMaximum(MitBuffer, Stochastic_period, i)];
      LowRange = MitBuffer[ArrayMinimum(MitBuffer, Stochastic_period, i)];
      delta = MitBuffer[i] - LowRange;
      DSS = delta/(HighRange - LowRange)*100.0;
      DssBuffer[i] = smooth_coefficient * (DSS - DssBuffer[i+1]) + DssBuffer[i+1];
      }

//----
   return(0);
  }
//+------------------------------------------------------------------+
Sample
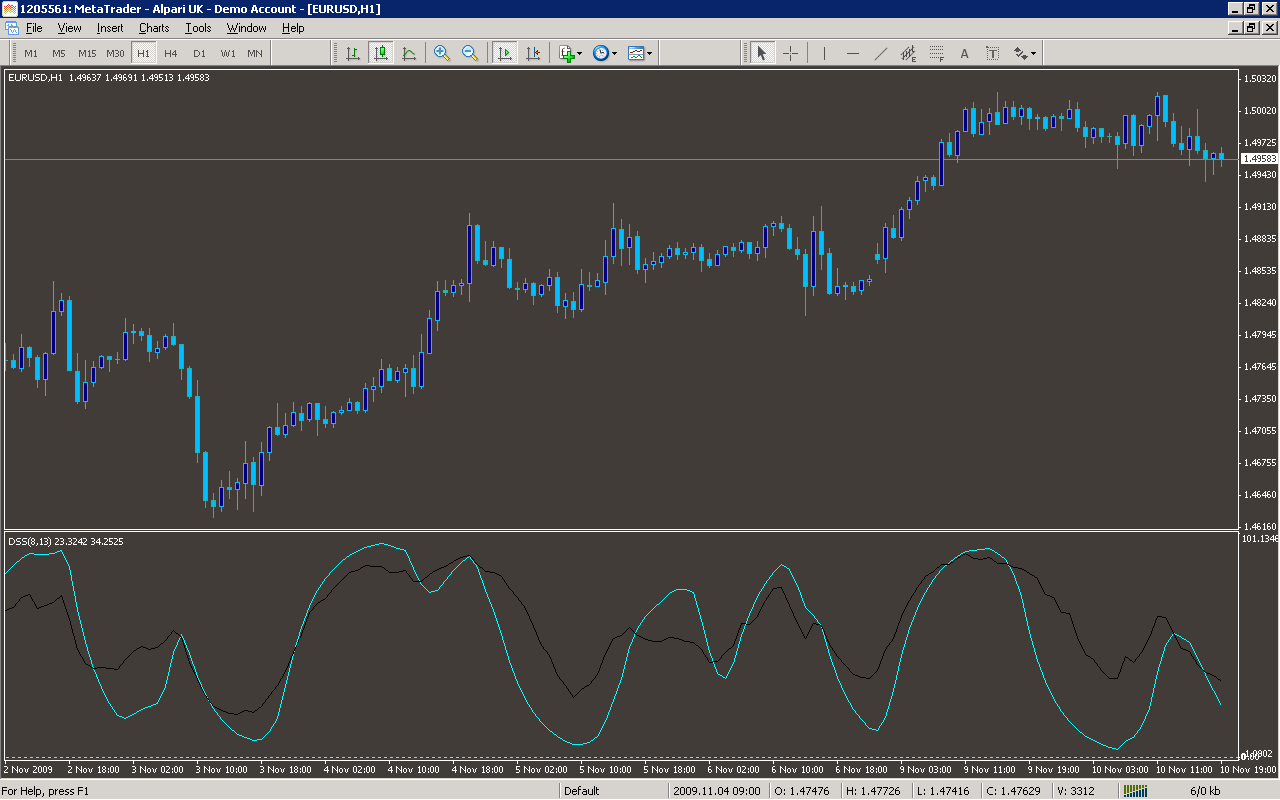
Analysis
Market Information Used:
Series array that contains the highest prices of each bar
Series array that contains the lowest prices of each bar
Series array that contains close prices for each bar
Indicator Curves created:
Implements a curve of type DRAW_LINE
Indicators Used:
Custom Indicators Used:
Order Management characteristics:
Other Features: