#property copyright "Copyright © 2006, klot."
#property link      "klot@mail.ru" // added Support & Resistance at static levels by ArshadFX

#property indicator_chart_window
#property indicator_buffers 5
#property indicator_color1 Aqua
#property indicator_color2 Blue
#property indicator_color3 Red
#property indicator_color4 Green
#property indicator_color5 Red
//---- indicator parameters
extern int ExtDepth=12;
extern bool ShowBreakup    =1;      // Show Breakup of ZigZag static levels / Support Resistance

//---- indicator buffers
double zzL[], zzH[], zz[], UP[], DN[];

int init()  // -------------- Custom indicator initialization function
  {
   SetIndexStyle(0,DRAW_SECTION); //---- drawing settings
   SetIndexStyle(1,DRAW_ARROW);  SetIndexArrow(1,228);
   SetIndexStyle(2,DRAW_ARROW);  SetIndexArrow(2,230);
   SetIndexStyle(3,DRAW_LINE);
   SetIndexStyle(4,DRAW_LINE);

   SetIndexBuffer(0,zz);      //---- indicator buffers mapping
   SetIndexBuffer(1,zzH);
   SetIndexBuffer(2,zzL);
   SetIndexBuffer(3,UP);
   SetIndexBuffer(4,DN);
   SetIndexEmptyValue(0,0.0);
   SetIndexEmptyValue(1,0.0);
   SetIndexEmptyValue(2,0.0);
   SetIndexEmptyValue(3,0.0);
   SetIndexEmptyValue(4,0.0);
   IndicatorShortName("DT_ZZ("+ExtDepth+")");
   return(0);
  }

int start()  // ----------------------------------- Main function call
  {
   int    i,x,shift,pos,lasthighpos,lastlowpos,curhighpos,curlowpos;
   double curlow,curhigh,lasthigh,lastlow, highS, lowS;  // highS= HighStatic ...
   double min, max;
   ArrayInitialize(zz,0.0);   ArrayInitialize(zzL,0.0);   ArrayInitialize(zzH,0.0);

   lasthighpos=Bars; lastlowpos=Bars;   lastlow=Low[Bars];lasthigh=High[Bars];

   for(shift=Bars-ExtDepth; shift>=0; shift--)     // loop of 12 block
    {
      curlowpos=Lowest(NULL,0,MODE_LOW,ExtDepth,shift);        // lowest price of 12 block
      curlow=Low[curlowpos];                                   // lowest bar index no
      curhighpos=Highest(NULL,0,MODE_HIGH,ExtDepth,shift);     // highest price of 12 block
      curhigh=High[curhighpos];                                // highest bar index no
      //------------------------------------------------
      if( curlow>=lastlow ) { lastlow=curlow; } // price is going up,
      else
         {
         if( lasthighpos>curlowpos  )
            {
            zzL[curlowpos]=curlow;
            min=100000; pos=lasthighpos;
            for(i=lasthighpos; i>=curlowpos; i--)
               {
               if (zzL[i]==0.0) continue;
               if (zzL[i]<min) { min=zzL[i]; pos=i; }
               zz[i]=0.0;
               }
            zz[pos]=min; highS=max;
            }
         lastlowpos=curlowpos;
         lastlow=curlow;
         }
      //--- high
      if( curhigh<=lasthigh )  { lasthigh=curhigh;}
      else
         {// We go upwards
         if( lastlowpos>curhighpos )
            {
            zzH[curhighpos]=curhigh;
            max=-100000; pos=lastlowpos;
            for(i=lastlowpos; i>=curhighpos; i--)
               {
               if (zzH[i]==0.0) continue;
               if (zzH[i]>max) { max=zzH[i]; pos=i; }
               zz[i]=0.0;
               }
            zz[pos]=max; lowS=min;
            }
         lasthighpos=curhighpos;
         lasthigh=curhigh;
         }
//   Added for displaying Breakups ------------- 17th of May, 2009
   if (ShowBreakup)
      {
      for(x=lasthighpos; x>0; x--)
         {
         UP[x]=highS;
         }
      for(x=lastlowpos; x>0; x--)
         {
         DN[x]=lowS;
         }
      }
   }
 return(0);
}
//+------------------------------------------------------------------+
Sample
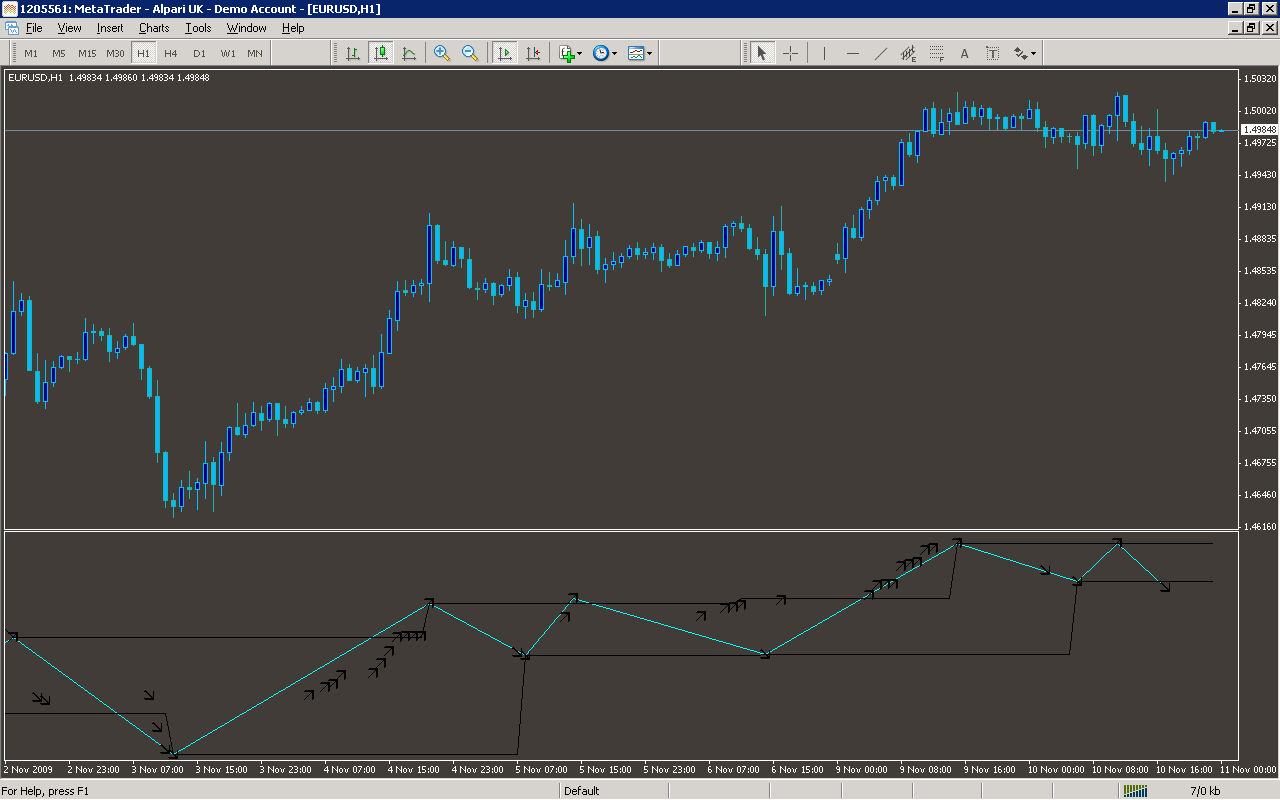
Analysis
Market Information Used:
Series array that contains the highest prices of each bar
Series array that contains the lowest prices of each bar
Indicator Curves created:
Implements a curve of type DRAW_SECTION
Implements a curve of type DRAW_ARROW
Implements a curve of type DRAW_LINE
Indicators Used:
Custom Indicators Used:
Order Management characteristics:
Other Features: