//+------------------------------------------------------------------+
//|                                              DT-ZigZag-Lauer.mq4 |
//+------------------------------------------------------------------+
#property copyright "Copyright © 2005, klot"
#property link      "klot@mail.ru"
//----
#property indicator_separate_window
#property indicator_minimum 0
#property indicator_maximum 2
#property indicator_buffers 2
#property indicator_color1 Blue
#property indicator_color2 Red
#property indicator_width1 4
#property indicator_width2 4
//---- input parameters
extern int       depth=50;//was 5
extern int GrossPeriod=5;//was 15
extern int MAX_Limit=300;
//---- buffers
double ExtMapBuffer1[];
double ExtMapBuffer2[];
datetime daytimes[];
double alertBar;
double prev;

//+------------------------------------------------------------------+
//| Custom indicator initialization function                         |
//+------------------------------------------------------------------+
int init()
  {
//---- indicators
   string short_name;

//---- name for DataWindow and indicator subwindow label
   short_name="MY(" + depth + ")";
   IndicatorShortName(short_name);
   SetIndexLabel(0, short_name);
   IndicatorDigits(0);
//----
   SetIndexStyle(0,DRAW_HISTOGRAM, STYLE_SOLID);
   SetIndexBuffer(0,ExtMapBuffer1);
   SetIndexEmptyValue(0,0.0);
   SetIndexStyle(1,DRAW_HISTOGRAM, STYLE_SOLID);
   SetIndexBuffer(1,ExtMapBuffer2);
   SetIndexEmptyValue(1,0.0);
//----
//----
//   if (Period()>GrossPeriod) { Alert("DT-ZigZag: Current timeframe must be less than", GrossPeriod); return(0); }
   // All Time[ ] series of time is sorted out in the direction of the decrease
   ArrayCopySeries(daytimes,MODE_TIME,Symbol(),GrossPeriod);
   return(0);
  }
//+------------------------------------------------------------------+
//| Custor indicator deinitialization function                       |
//+------------------------------------------------------------------+
int deinit()
  {
//----
//----
   return(0);
  }
//+------------------------------------------------------------------+
//| Custom indicator iteration function                              |
//+------------------------------------------------------------------+
int start()
  {
   int    counted_bars=IndicatorCounted();
   int    limit=MAX_Limit,bigshift;
   double zigzag1;
   if (counted_bars<0) return(-1);
   if (counted_bars>0) counted_bars--;
   limit=Bars-counted_bars;
//----
   for(int i=0; i<limit; i++)
     {
      if(Time[i]>=daytimes[0]) bigshift=0;
      else
        {
         bigshift=ArrayBsearch(daytimes,Time[i-1],WHOLE_ARRAY,0,MODE_DESCEND);
         if(Period()<=GrossPeriod) bigshift++;
        }
      for(int cnt=bigshift; cnt<(300+bigshift); cnt++)
        {
         zigzag1=iCustom(NULL,GrossPeriod,"Zigzag",depth,15,9,0,cnt+1);
         if(zigzag1!=0)break;
        }
      if(iClose(NULL,0,i+1)<=zigzag1)ExtMapBuffer2[i]=1; else ExtMapBuffer2[i]=0.0;
      if(i==0 && prev != ExtMapBuffer2[i] && ExtMapBuffer1[i] == 1 && ExtMapBuffer2[i] == 0 && Bars>alertBar) {Alert("DT-ZZ Alert changing Up " + Symbol() + " on the " +  Period() + " minute chart.");alertBar = Bars;prev = ExtMapBuffer2[i];}
      if(iClose(NULL,0,i+1)>=zigzag1)ExtMapBuffer1[i]=1; else ExtMapBuffer1[i]=0.0;
      if(i==0 && prev != ExtMapBuffer2[i] && ExtMapBuffer1[i] == 0 && ExtMapBuffer2[i] == 1 && Bars>alertBar) {Alert("DT-ZZ Alert changing Down " + Symbol() + " on the " +  Period() + " minute chart.");alertBar = Bars;prev = ExtMapBuffer2[i];}
      ObjectsRedraw();
     }
   // Comment("zigzag1 = ",zigzag1);
//----
   return(0);
  }
//+------------------------------------------------------------------+
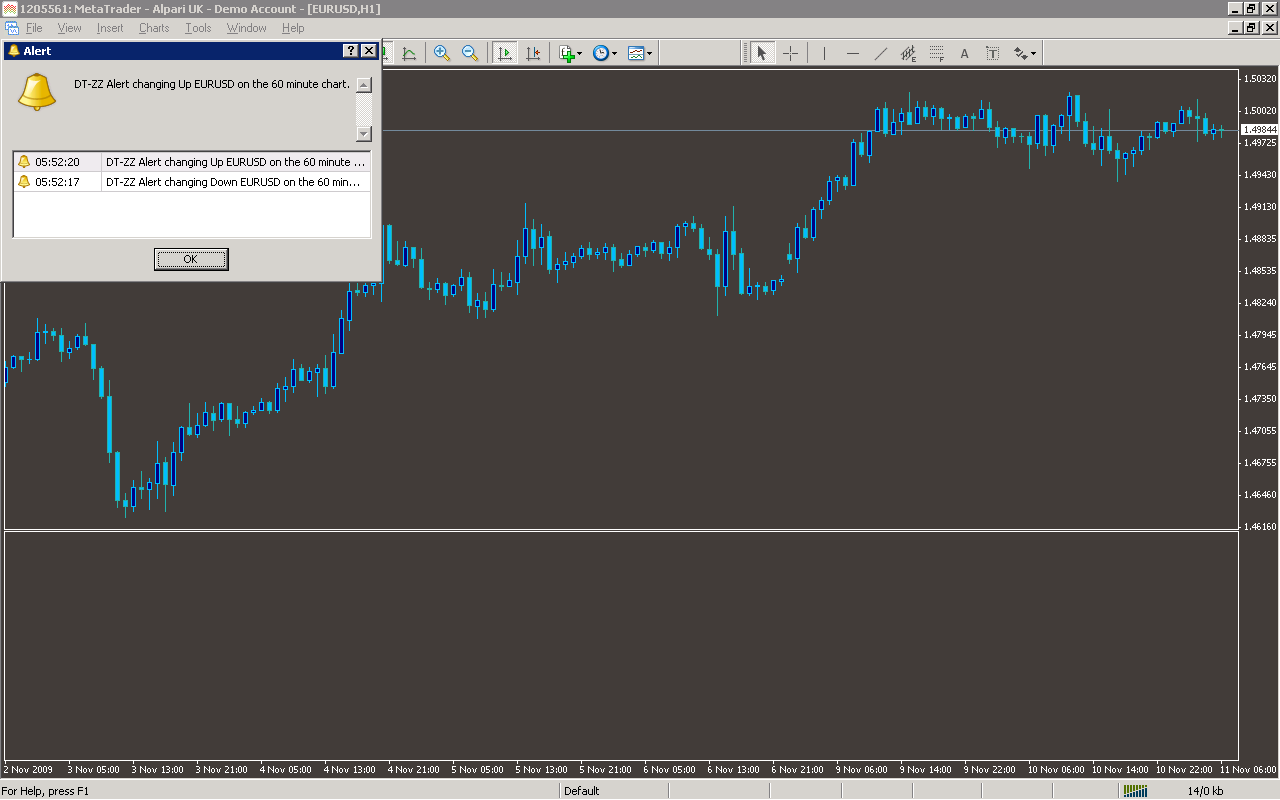
Sample
Analysis
Market Information Used:
Series array that contains open time of each bar
Series array that contains close prices for each bar
Indicator Curves created:
Implements a curve of type DRAW_HISTOGRAM
Indicators Used:
Custom Indicators Used:
ZigZag
Order Management characteristics:
Other Features:
It issuies visual alerts to the screen