//+------------------------------------------------------------------+
//|                                                   TSR_Ranges.mq4 |
//|                                         Copyright © 2006, Ogeima |
//|                                             ph_bresson@yahoo.com |
//| made for FXiGoR for the TSR Trend Slope Retracement method       |
//| modified to the DYNAMIC Daily Range Breakout System             |
//+------------------------------------------------------------------+
#property copyright "Copyright © 2006, Ogeima"
#property link      "ph_bresson@yahoo.com"

#property indicator_chart_window
//---- input parameters
extern double  Risk_to_Reward_ratio =  3.0;
int nDigits;
//+------------------------------------------------------------------+
//| Custom indicator initialization function                         |
//+------------------------------------------------------------------+
int init()
{
   if(Symbol()=="GBPJPY" || Symbol()=="EURJPY" || Symbol()=="USDJPY" || Symbol()=="GOLD")  nDigits = 2;
   else nDigits = 4;

   return(0);
}
//+------------------------------------------------------------------+
//| Custom indicator deinitialization function                       |
//+------------------------------------------------------------------+
int deinit()
  {
//----

//----
   return(0);
  }
//+------------------------------------------------------------------+
//| Custom indicator iteration function                              |
//+------------------------------------------------------------------+
int start()
  {
   //----
   int R1=0,R5=0,R10=0,R20=0,RAvg=0;
   int RoomUp=0,RoomDown=0,StopLoss_Long=0,StopLoss_Short=0;
   double   SL_Long=0,SL_Short=0;
   double   low0=0,high0=0;
   string   Text="";
   int i=0;

   R1 =  (iHigh(NULL,PERIOD_D1,1)-iLow(NULL,PERIOD_D1,1))/Point;
   for(i=1;i<=5;i++)
      R5    =    R5  +  (iHigh(NULL,PERIOD_D1,i)-iLow(NULL,PERIOD_D1,i))/Point;
   for(i=1;i<=10;i++)
      R10   =    R10 +  (iHigh(NULL,PERIOD_D1,i)-iLow(NULL,PERIOD_D1,i))/Point;
   for(i=1;i<=20;i++)
      R20   =    R20 +  (iHigh(NULL,PERIOD_D1,i)-iLow(NULL,PERIOD_D1,i))/Point;

   R5 = R5/5;
   R10 = R10/10;
   R20 = R20/20;
   RAvg  =  (R1+R5+R10+R20)/4;

   low0  =  iLow(NULL,PERIOD_D1,0);
   high0 =  iHigh(NULL,PERIOD_D1,0);
   RoomUp   =  RAvg - (Bid - low0)/Point;
   RoomDown =  RAvg - (high0 - Bid)/Point;
   StopLoss_Long  =  RoomUp/Risk_to_Reward_ratio;
   SL_Long        =  Bid - StopLoss_Long*Point;
   StopLoss_Short =  RoomDown/Risk_to_Reward_ratio;
   SL_Short       =  Bid + StopLoss_Short*Point;


   Text =   "Average Day  Range: " +  RAvg + "\n"  +
            "Prev 01  Day  Range: " +  R1   + "\n" +
            "Prev 05  Days Range: " +  R5   + "\n" +
            "Prev 10  Days Range: " +  R10  + "\n" +
            "Prev 20  Days Range: " +  R20  + "\n";
   Text =   Text +
            "Room Up:     " + RoomUp              + "\n" +
            "Room Down: " + RoomDown            + "\n" ;

   Comment(Text);

   return(0);
  }
//+------------------------------------------------------------------+
Sample
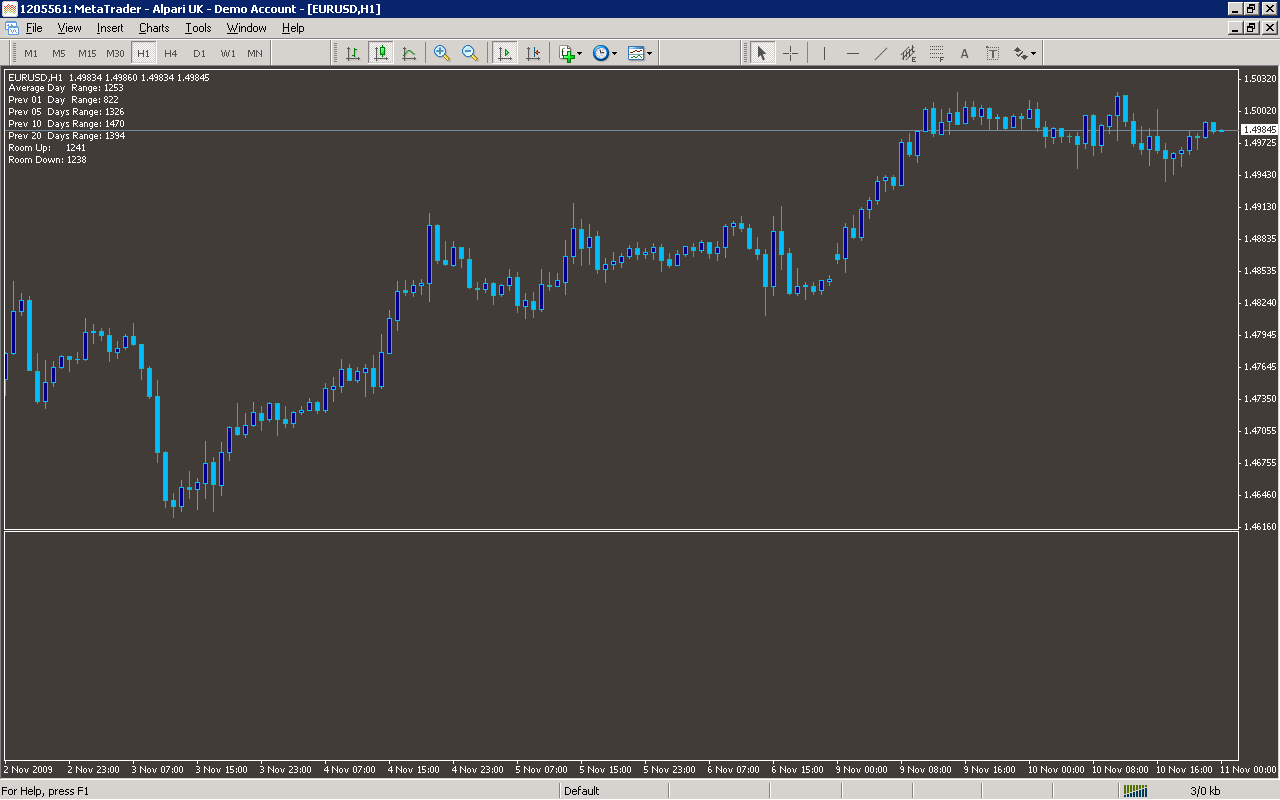
Analysis
Market Information Used:
Series array that contains the highest prices of each bar
Series array that contains the lowest prices of each bar
Indicator Curves created:
Indicators Used:
Custom Indicators Used:
Order Management characteristics:
Other Features: