//+------------------------------------------------------------------+
//|                                              DeMarker Pivots.mq4 |
//|                  These are the main pivots used by Thomas DeMark |
//|                                                  Written by: Ice |
//+------------------------------------------------------------------+
#property copyright "2005 Free software for trader"

#property indicator_chart_window
#property indicator_buffers 7
#property indicator_color1 Blue
#property indicator_color2 Green
#property indicator_color3 Yellow
#property indicator_color4 LawnGreen
#property indicator_color5 Red
#property indicator_color6 Green
#property indicator_color7 LawnGreen
//----
datetime BT[];
double YesterdayHigh[50];
double YesterdayLow[50];
double YesterdayClose[50];
//---- buffers
double R1Array[];
double LongTP50[];
double LongSL50[];
double LongTP100[];
double S1Array[];
double ShortTP50[];
double ShortTP100[];

//+------------------------------------------------------------------+
//| Custom indicator initialization function |
//+------------------------------------------------------------------+
int init()
  {

// Resistance 1
   SetIndexStyle(0, DRAW_LINE);
   SetIndexBuffer(0, R1Array);
   SetIndexLabel(0, "R1");
// Support 1
   SetIndexStyle(1, DRAW_LINE, STYLE_DOT);
   SetIndexBuffer(1, LongTP50);
   SetIndexLabel(1, "LongTP50");
// Resistance 2
   SetIndexStyle(2, DRAW_LINE, STYLE_DOT);
   SetIndexBuffer(2, LongSL50);
   SetIndexLabel(2, "LongSL50");
// Support 2
   SetIndexStyle(3, DRAW_LINE, STYLE_DOT);
   SetIndexBuffer(3, LongTP100);
   SetIndexLabel(3, "LongTP100");

   SetIndexStyle(4, DRAW_LINE);
   SetIndexBuffer(4, S1Array);
   SetIndexLabel(4, "S1");

   SetIndexStyle(5, DRAW_LINE, STYLE_DOT);
   SetIndexBuffer(5, ShortTP50);
   SetIndexLabel(5, "ShortTP50");

   SetIndexStyle(6, DRAW_LINE, STYLE_DOT);
   SetIndexBuffer(6, ShortTP100);
   SetIndexLabel(6, "ShortTP100");
//----
   return(0);
  }
//+------------------------------------------------------------------+
//| Custor indicator deinitialization function                       |
//+------------------------------------------------------------------+
int deinit()
  {
   return(0);
  }
//+------------------------------------------------------------------+
//| Custom indicator iteration function                              |
//+------------------------------------------------------------------+
int start()
  {
   int counted_bars = IndicatorCounted();
   ArrayResize(BT, Bars);
   Print("Bars = " + Bars);
// Fill BT with bar open TIME
   ArrayCopySeries(BT, MODE_TIME);
// Fill temp arrays with High, Low and Close prices per day
   ArrayCopySeries(YesterdayHigh, MODE_HIGH, Symbol(), PERIOD_D1);
   ArrayCopySeries(YesterdayLow, MODE_LOW, Symbol(), PERIOD_D1);
   ArrayCopySeries(YesterdayClose, MODE_CLOSE, Symbol(), PERIOD_D1);
//----
   int od = 0;
   int dd = 0;
//----
   double Pivot;
   double R1;
   double LTP50;
   double LSL50;
   double LTP100;
   double S1;
   double STP50;
   double STP100;
   double gap;
//Cycle through all the bars and fill the indicator bars with the Pivot point values
   for(int i = 0; i <= Bars; i++)
     {
       if(TimeDay(BT[i]) != od)
         {
           dd++;
           Pivot = (YesterdayHigh[dd] + YesterdayLow[dd] + YesterdayClose[dd]) / 3;
           R1 = YesterdayHigh[dd];
           S1 = YesterdayLow[dd];
           gap = R1-S1;
           LTP50 = R1+(gap/2);
           LSL50 = R1-(gap/2);
           LTP100 = R1+gap;
           STP50 = S1-(gap/2);
           STP100 = S1-gap;
           od = TimeDay(BT[i]);
         }
       //----
       //PivotArray[i] = Pivot;
       R1Array[i]=R1;
       S1Array[i]=S1;
       LongTP50[i]=LTP50;
       LongSL50[i]=LSL50;
       LongTP100[i]=LTP100;
       ShortTP50[i] = STP50;
       ShortTP100[i] = STP100;

     }
//----
   return(0);
  }
//+------------------------------------------------------------------+
Sample
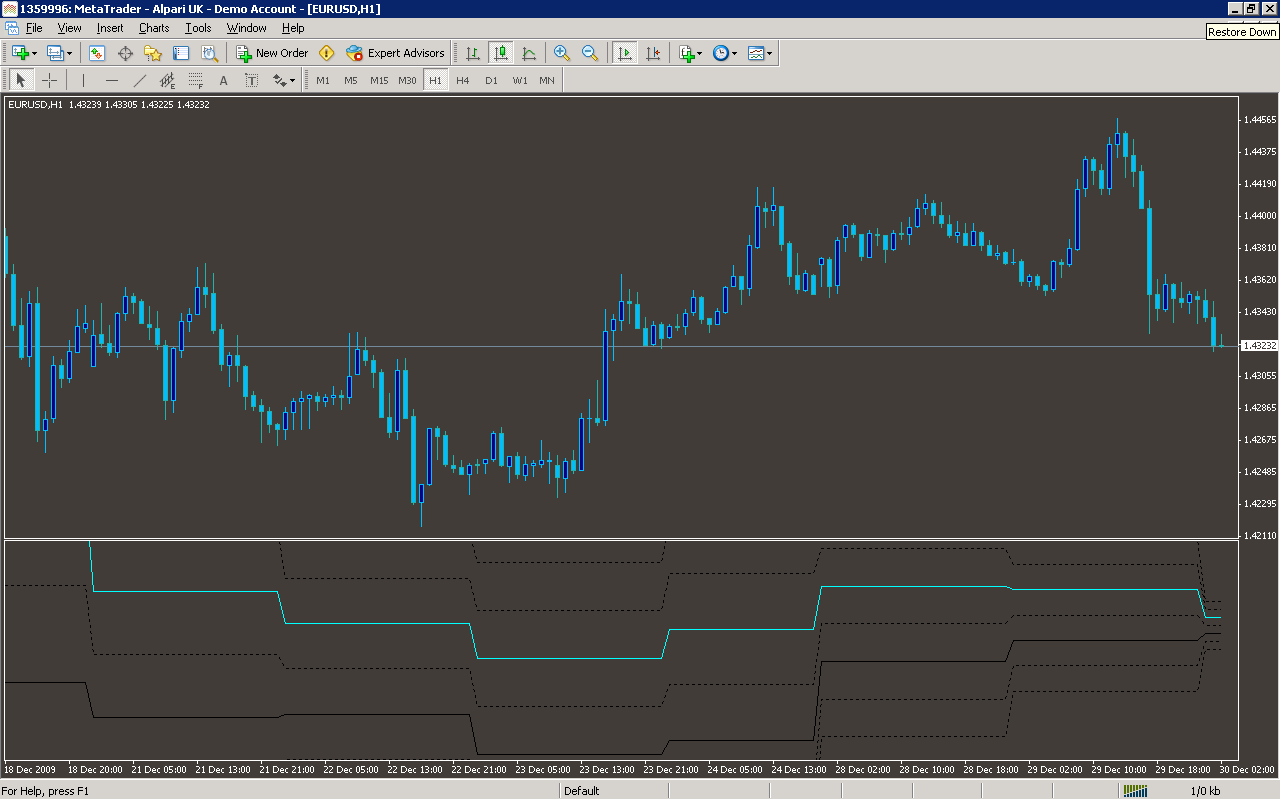
Analysis
Market Information Used:
Series array that contains the highest prices of each bar
Series array that contains the lowest prices of each bar
Series array that contains close prices for each bar
Indicator Curves created:
Implements a curve of type DRAW_LINE
Indicators Used:
Custom Indicators Used:
Order Management characteristics:
Other Features: