//+------------------------------------------------------------------+
//| Ehlers COG.mq4 |
//+------------------------------------------------------------------+
#property indicator_separate_window
#property indicator_buffers 2
#property indicator_color1 Red
#property indicator_color2 Blue
extern int COGPeriod = 10;
double COG[], COG1[], wrkArray[];
//+------------------------------------------------------------------+
int init()
{
IndicatorBuffers(2);
IndicatorDigits( MarketInfo( Symbol(), MODE_DIGITS ));
SetIndexStyle(0, DRAW_LINE);
SetIndexStyle(1, DRAW_LINE);
if( !SetIndexBuffer( 0, COG ) &&
!SetIndexBuffer( 1, COG1 ))
Print( "cannot set indicator buffers!" );
SetIndexDrawBegin( 0, COGPeriod );
SetIndexDrawBegin( 1, COGPeriod );
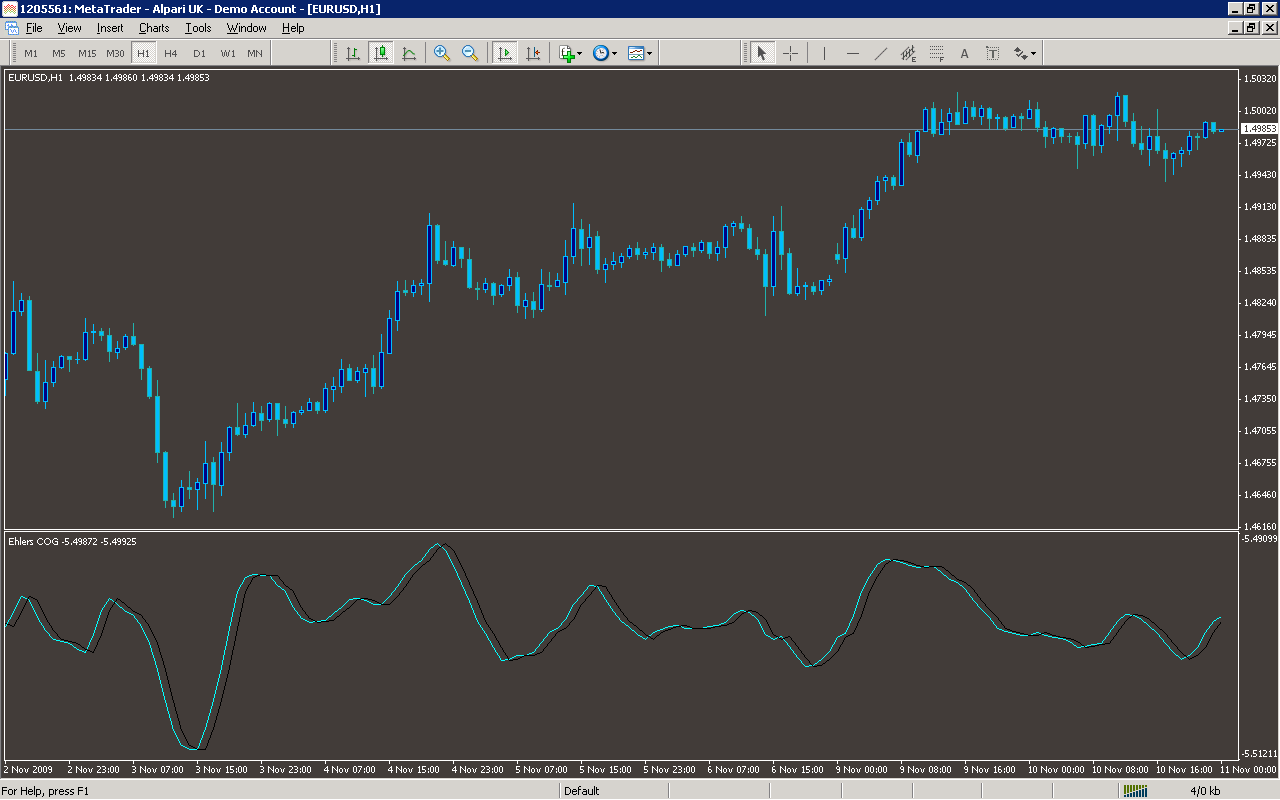
IndicatorShortName( "Ehlers COG" );
return(0);
}
//+------------------------------------------------------------------+
// Calculating Ehlers Center of Gravity
//+------------------------------------------------------------------+
// COG = -1 * (NUM / DENOM)
// NUM = the sum of [PRICE[i] * (i + 1)] from 0 to N
// DENOM = the sum of PRICE[i] from 0 to N
// where N equals the number of periods (COGPeriod)
// PRICE[0] equals the current bar
// PRICE[1] equals the previous bar
// PRICE[n] equals the price from n bars previous
//+------------------------------------------------------------------+
int start()
{
int i, j, limit, iWrk00;
int countedBars = IndicatorCounted();
double dWrk00, num, denom;
limit = Bars - countedBars;
for( i = 0; i < limit; i++ )
{
if((i >= COGPeriod) || (limit < 10))
{
num = 0;
denom = 0;
for( j = 0; j < COGPeriod; j++)
{
if(limit < 10)
iWrk00 = i + j;
else
iWrk00 = i - COGPeriod + j;
dWrk00 = (High[iWrk00] + Low[iWrk00]) / 2;
num = num + (1 + j) * dWrk00;
denom = denom + dWrk00;
}
if(limit < 10)
iWrk00 = i;
else
iWrk00 = i - COGPeriod;
COG[iWrk00] = -num / denom;
if(iWrk00 > 0)
COG1[iWrk00 - 1] = COG[iWrk00];
}
}
return(0);
}
//+------------------------------------------------------------------+ It doesn't seem to be charting out for me
Sample
Analysis
Market Information Used:
Series array that contains the highest prices of each bar
Series array that contains the lowest prices of each bar
Indicator Curves created:
Implements a curve of type DRAW_LINE
Indicators Used:
Custom Indicators Used:
Order Management characteristics:
Other Features: