//+----------------------------------------------------------+
//|                                 Ehlers' fisher transform |
//|                                                   mladen |
//+----------------------------------------------------------+
#property  copyright "mladen"
#property  link      "mladenfx@gmail.com"

#property  indicator_separate_window
#property  indicator_buffers 5
#property  indicator_color1  Green
#property  indicator_color2  Green
#property  indicator_color3  Red
#property  indicator_color4  Red
#property  indicator_color5  DimGray
#property  indicator_width1  2
#property  indicator_width3  2
#property  indicator_width5  2

//
//
//
//
//

extern int  period    = 10;
extern int  PriceType = PRICE_MEDIAN;

//
//
//
//
//

double buffer1[];
double buffer2[];
double buffer3[];
double buffer4[];
double buffer5[];
double Prices[];
double Values[];


//+----------------------------------------------------------+
//|                                                          |
//+----------------------------------------------------------+
//
//
//
//
//

int init()
{
   IndicatorBuffers(7);
      SetIndexBuffer(0,buffer1); SetIndexStyle(0,DRAW_HISTOGRAM);
      SetIndexBuffer(1,buffer2); SetIndexStyle(1,DRAW_HISTOGRAM);
      SetIndexBuffer(2,buffer3); SetIndexStyle(2,DRAW_HISTOGRAM);
      SetIndexBuffer(3,buffer4); SetIndexStyle(3,DRAW_HISTOGRAM);
      SetIndexBuffer(4,buffer5);
      SetIndexBuffer(5,Prices);
      SetIndexBuffer(6,Values);
   IndicatorShortName("Ehlers\' Fisher transform ("+period+")");
   return(0);
}


//+----------------------------------------------------------+
//|                                                          |
//+----------------------------------------------------------+
//
//
//
//
//

int start()
{
   int  counted_bars=IndicatorCounted();
   int  i,limit;

   if(counted_bars < 0) return(-1);
   if(counted_bars > 0) counted_bars--;
           limit = Bars-counted_bars;

   //
   //
   //
   //
   //

   for(i=limit; i>=0; i--)
   {
      Prices[i] = iMA(NULL,0,1,0,MODE_SMA,PriceType,i);

      //
      //
      //
      //
      //

         double MaxH = Prices[ArrayMaximum(Prices,period,i)];
         double MinL = Prices[ArrayMinimum(Prices,period,i)];
         if (MaxH!=MinL)
               Values[i] = 0.33*2*((Prices[i]-MinL)/(MaxH-MinL)-0.5)+0.67*Values[i+1];
         else  Values[i] = 0.00;
               Values[i] = MathMin(MathMax(Values[i],-0.999),0.999);
               buffer5[i] = 0.5*MathLog((1+Values[i])/(1-Values[i]))+0.5*buffer5[i+1];

      //
      //
      //
      //
      //

         if(buffer5[i]==buffer5[i+1])
            {
               buffer1[i]=buffer1[i+1];
               buffer2[i]=buffer2[i+1];
               buffer3[i]=buffer3[i+1];
               buffer4[i]=buffer4[i+1];
               continue;
            }

         //
         //
         //
         //
         //

            buffer1[i]=EMPTY_VALUE;
            buffer2[i]=EMPTY_VALUE;
            buffer3[i]=EMPTY_VALUE;
            buffer4[i]=EMPTY_VALUE;
            if(buffer5[i]<0)
               {
                  if (buffer5[i]<buffer5[i+1]) buffer3[i]=buffer5[i];
                  if (buffer5[i]>buffer5[i+1]) buffer4[i]=buffer5[i];
               }
            if(buffer5[i]>0)
               {
                  if (buffer5[i]<buffer5[i+1]) buffer2[i]=buffer5[i];
                  if (buffer5[i]>buffer5[i+1]) buffer1[i]=buffer5[i];
               }
   }
   return(0);
}
Sample
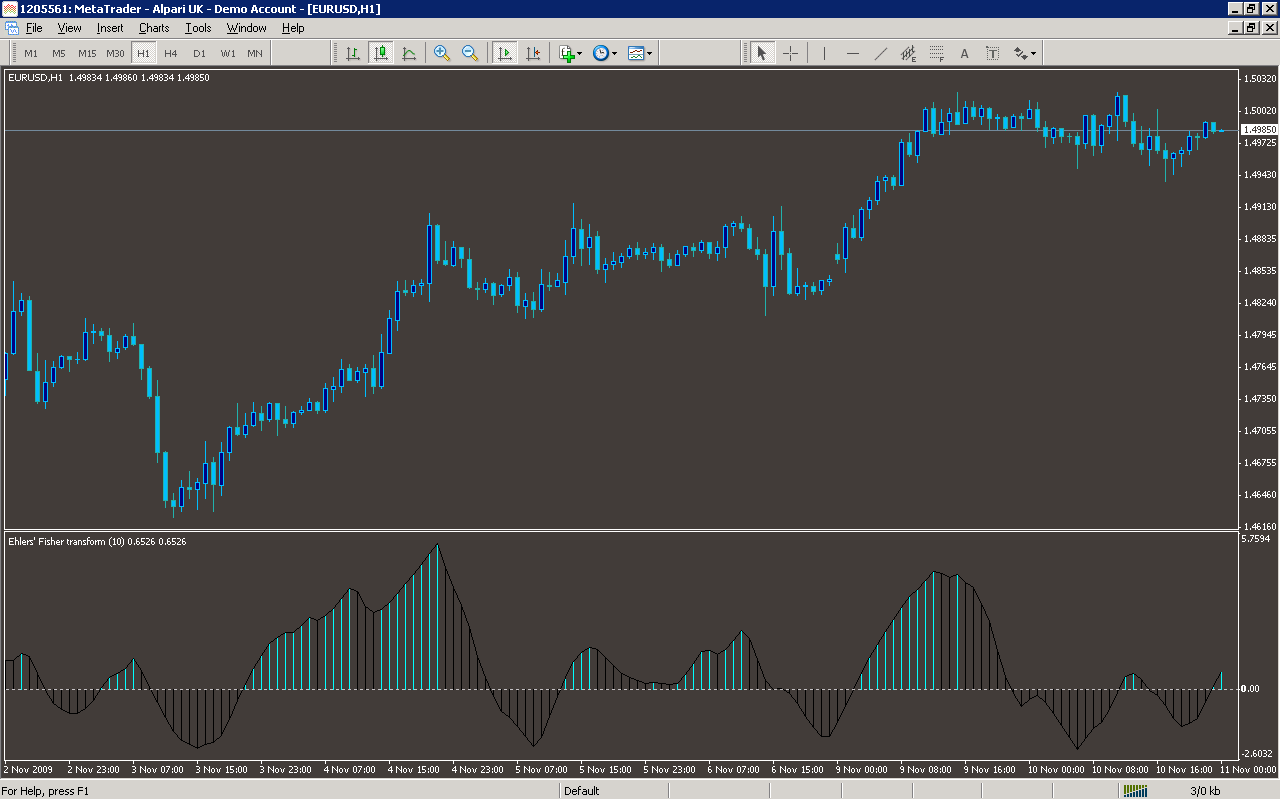
Analysis
Market Information Used:
Indicator Curves created:
Implements a curve of type DRAW_HISTOGRAM
Indicators Used:
Moving average indicator
Custom Indicators Used:
Order Management characteristics:
Other Features: