//+------------------------------------------------------------------+
//| Ehlers iTrend.mq4 |
//| Copyright © 2006, MetaQuotes Software Corp. |
//| http://www.metaquotes.net |
//+------------------------------------------------------------------+
// new coding attempt below:
//Model Ehler's iTrend.mq4, for Metatrader 4, 13 August 2006
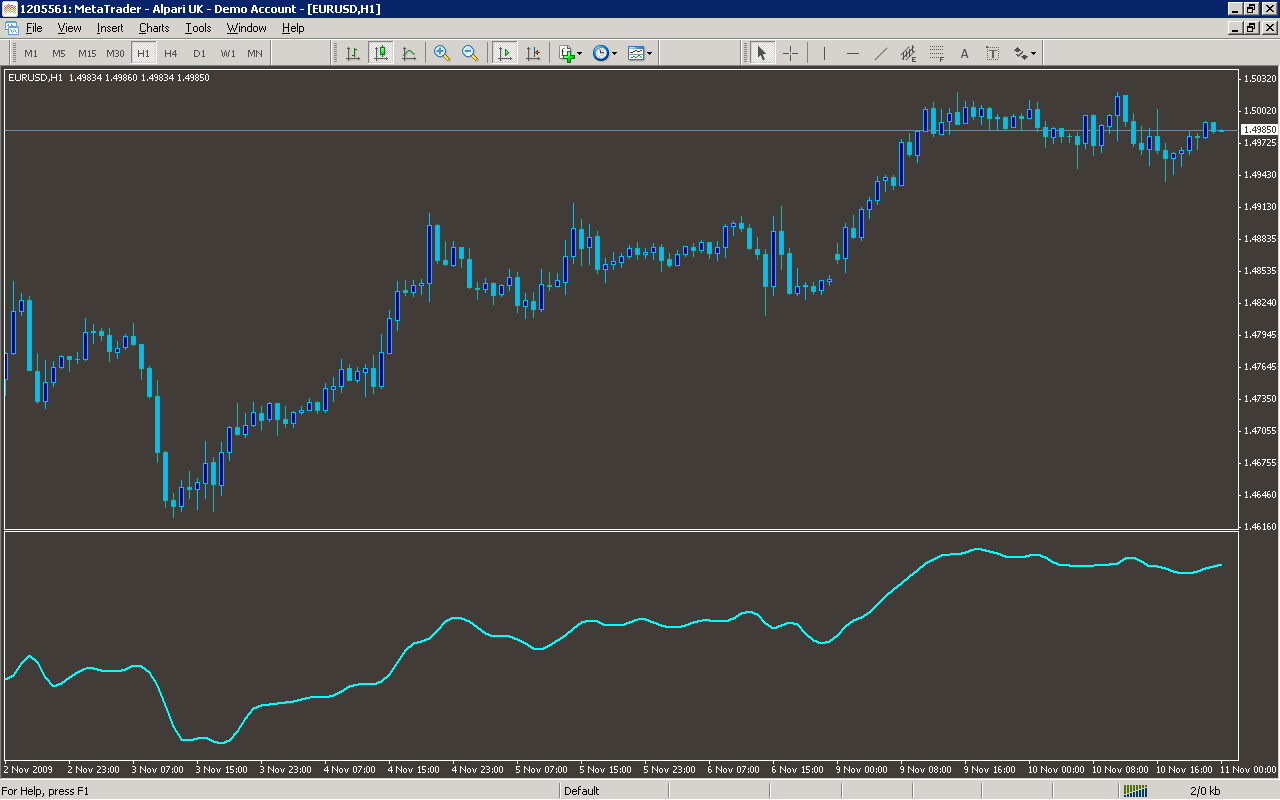
// - this custom indicator plots an interesting TREND line
// on a chart
//this initial 'beta' version appears to 'work' -
// but every user should check it out before using it -
// this code below may still have unknown bugs?
// 'use at your own risk' please post suggestions for
// corrections and improvements to this code (.MQ4)
// - 'Bill_gigi' on YAHOO 'MetaTrader_Experts_and_Indicators'
#property indicator_chart_window
#property indicator_buffers 1
#property indicator_color1 Orange // DodgerBlue
//---- input parameters
extern int Length=10;
//---- buffers
double TREND[]; // otherwise called "Model" by Ehlers
double iTrend[];
double Price[];
double Slope[];
double HP[];
//---- Varibles
int j, i, n, counted_bars, limit, totalBars;
double SMA=0.0, SmoothSlope=0.0, twopi=6.2831853, X=0.0;
double Alpha=0.0, SmoothHP=0.0, Prev = 0.0;
// Custom indicator initialization function
int init()
{
string short_name;
//---- additional buffers used
IndicatorBuffers(5);
//---- indicator line
SetIndexStyle(0, DRAW_LINE, STYLE_SOLID, 2);
SetIndexBuffer(0,TREND);
SetIndexBuffer(1,iTrend);
SetIndexBuffer(2,Price);
SetIndexBuffer(3,Slope);
SetIndexBuffer(4,HP);
//---- name for DataWindow and indicator subwindow label
short_name="TREND("+Length+")";
IndicatorShortName(short_name);
SetIndexLabel(0,short_name);
//----
// SetIndexDrawBegin(0,Length);
//----
return(0);
}
//+------------------------------------------------------------------+
int start()
{
counted_bars=IndicatorCounted();
totalBars = Bars;
//----
if(totalBars<=Length) return(0);
Alpha = (1 - MathSin(twopi/Length)) / MathCos(twopi/Length);
i=totalBars-counted_bars-1;
while(i>=0)
{
if(i >= (totalBars - Length))
{
Price[i] = (High[i] + Low[i])/2;
TREND[i] = 0.0;
SMA = 0.0;
HP[i] = 0.0;
Slope[i] = 0.0;
}
else
{
Price[i] = (High[i] + Low[i])/2;
X = 0.0;
for(j = Length-1; j > -1; j--)
{
X = X + Price[i+j];
}
SMA = X/Length;
// below compute iTrend[i] ~ "instantaneous Trend Line" component of the Model trend
Slope[i] = (Price[i] - Price[i + Length - 1])/2.0;
SmoothSlope = (Slope[i] + 2.0*Slope[i+1]+ 2.0*Slope
[i+2] + Slope[i+3])/6.0;
iTrend[i] = (0.5 * SmoothSlope) + SMA;
// below is code for the Ehler's 'Cyclic Component'
HP[i] = 0.5*(1+Alpha)* (Price[i] - Price[i+1]) +
Alpha*HP[i+1];
SmoothHP = (HP[i] + 2.0*HP[i+1] + 2.0*HP[i+2] + HP
[i+3])/6.0;
} // end of above 'else' condition
TREND[i] = iTrend[i] + SmoothHP;
i--;
} // end of 'while' loop
return(0);
}
Sample
Analysis
Market Information Used:
Series array that contains the highest prices of each bar
Series array that contains the lowest prices of each bar
Indicator Curves created:
Implements a curve of type DRAW_LINE
Indicators Used:
Custom Indicators Used:
Order Management characteristics:
Other Features: