// at the end of the file you'll find the Easy Language code


#property copyright ""
#property link      ""

#property indicator_chart_window
#property indicator_buffers 1
#property indicator_color1 Red

extern int  Length = 20;

int         ExtCountedBars=0;

double      smooth[];
double      coef[];
double      distance2[];
//---- buffers
double      ExtMapBuffer[];
//----
//+------------------------------------------------------------------+
//| Custom indicator initialization function                         |
//+------------------------------------------------------------------+
int init()
  {
   int    draw_begin;
   string short_name;

//---- drawing settings
   IndicatorBuffers(4);
   SetIndexStyle(0,DRAW_LINE);
   SetIndexShift(0,0);
   IndicatorDigits(MarketInfo(Symbol(),MODE_DIGITS));

   draw_begin=Length-1;
   short_name = "Ehlers(";
   IndicatorShortName(short_name+Length+")");
   SetIndexDrawBegin(0,draw_begin);
//---- indicator buffers mapping
   SetIndexBuffer(0,ExtMapBuffer);
   SetIndexBuffer(1, smooth);
   SetIndexBuffer(2, coef);
   SetIndexBuffer(3, distance2);
//---- initialization done
   return(0);
  }
//+------------------------------------------------------------------+
//|                                                                  |
//+------------------------------------------------------------------+
int start()
  {
   if(Bars<=Length) return(0);
   ExtCountedBars=IndicatorCounted();
//---- check for possible errors
   if (ExtCountedBars<0) return(-1);
//---- last counted bar will be recounted
   if (ExtCountedBars>0) ExtCountedBars--;
//----
   Ehlers();
   return(0);
  }

void Ehlers()
{
  int         count=0;
  int         lookback=0;
  double      sumcoef=0;
  double      num=0;
  int    pos=Bars-ExtCountedBars-1;
  int    pos2 = pos;
  if(pos2 > Bars-3) pos2 = Bars-3;
  while(pos2>=0)
  {
     smooth[pos2]=(Close[pos2] + 2*Close[pos2+1] + 2*Close[pos2+2] + Close[pos2+3]) / 6;
     pos2--;
  }
  if(pos>Bars-Length-3) pos = Bars-Length-3;
  while(pos>=0) {
//---- initial accumulation ???
     for(count=0;count<Length; count++){
        distance2[count]=0;
        for(lookback=1;lookback<Length;lookback++)
        {
           distance2[count] = distance2[count] + (smooth[pos+count] - smooth[pos+count + lookback])*(smooth[pos+count]- smooth[pos+count + lookback]);
        }
        coef[count] = distance2[count];
     }

     num = 0;
     sumcoef = 0;
     for(count=0;count<Length;count++)
     {
        num = num + coef[count]*smooth[pos+count];
        sumcoef = sumcoef + coef[count];
     }
     if (sumcoef != 0)  ExtMapBuffer[pos] = num / sumcoef;
     pos--;
  }
}
//+------------------------------------------------------------------+
/* Below is the EasyLanguage code:

Inputs:	Price((H+L)/2), Length(20);

Vars:	Smooth(0), count(0), LookBack(0), SumCoef(0), Num(0), Filt(0);

Array:	Coef[50](0), Distance2[50](0);

Smooth = (Price + 2*Price[1] + 2*Price[2] + Price[3]) / 6;
For count = 0 to Length -1 begin
   Distance2[count] = 0;
   For Lookback = 1 to Length-1 begin
      Distance2[count] = Distance2[count] + (Smooth[count] - Smooth[count + Lookback])*(Smooth[count]
	- Smooth[count + Lookback]);
   End;
   Coef[count] = Distance2[count];
End;
Num = 0;
SumCoef = 0;
For count = 0 to Length -1 begin
   Num = Num + Coef[count]*Smooth[count];
   SumCoef = Sumcoef + Coef[count];
End;
If SumCoef <> 0 then Filt = Num / SumCoef;

Plot1(Filt, "Ehlers");
*/
Sample
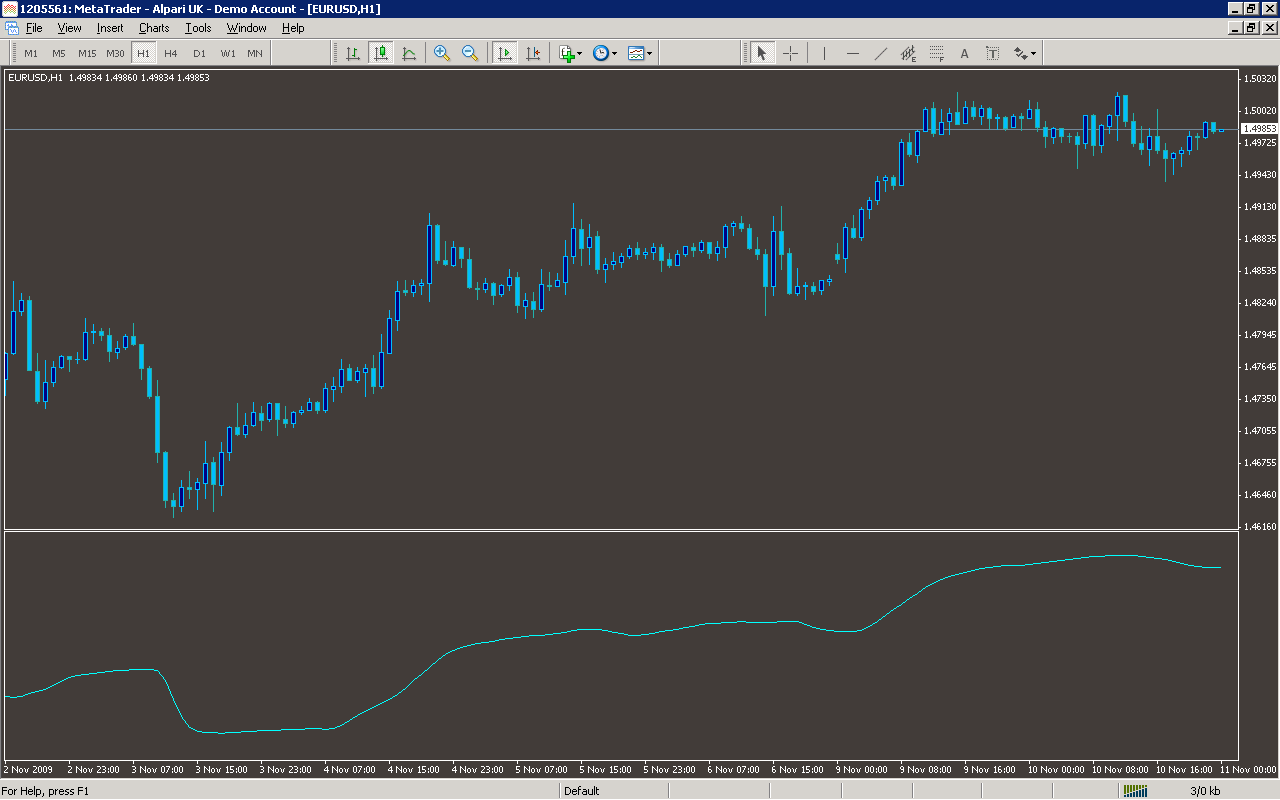
Analysis
Market Information Used:
Series array that contains close prices for each bar
Indicator Curves created:
Implements a curve of type DRAW_LINE
Indicators Used:
Custom Indicators Used:
Order Management characteristics:
Other Features: