//+------------------------------------------------------------------+
//|                                                 Kase CD Peak.mq4 |
//|                                                 Copyright © 2006 |
//|                                        http://www.stupidlife.org |
//|                                              gexabox.@.mail...ru |
//+------------------------------------------------------------------+
/*
RWH:=(H-Ref(L,-Per1))/(ATR(Per1)*Sqrt(Per1));
RWL:=(Ref(H,-Per1)-L)/(ATR(Per1)*Sqrt(Per1));
Pk:= Mov(Mov((RWH-RWL),3,W),3,S);
KCD:= PK-Mov(PK,8,S);
MN:= Mov(KCD,Per1,S);
SD:= Stdev(KCD,Per1);
Val1:= If(MN+(1.33*SD)>2.08,MN+(1.33*SD),2.08);
Val2:= If(MN-(1.33*SD)<-1.92,MN-(1.33*SD),-1.92);
LN:= If(Ref(KCD,-1)>=0 AND KCD>0,Val1,If(Ref(KCD,-1)<=0 AND KCD<0,Val2,0));
Red:= If(Ref(KCD,-1)>KCD,KCD,0);
Green:= If(KCD>Ref(KCD,-1),KCD,0);
*/
#property copyright "Copyright © 2006"
#property link      "http://www.stupidlife.org"

#property indicator_separate_window
#property indicator_buffers 3
#property indicator_color1 Gold
#property indicator_color2 Red
#property indicator_color3 Lime

//---- input parameters
extern int       Periods=8;
//---- buffers
double LN[];
double RedHist[];
double GreenHist[];

double RWArr[];
double PrePk[];
double Pk[];
double KCD[];

double SqrtPer;

//+------------------------------------------------------------------+
//| Custom indicator initialization function                         |
//+------------------------------------------------------------------+
int init()
  {
//---- 2 additional buffers are used for counting.
   IndicatorBuffers(7);
//---- name for DataWindow and indicator subwindow label
   IndicatorShortName("KaseCD("+Periods+")");
//---- indicators
   SetIndexStyle(0,DRAW_LINE);
   SetIndexBuffer(0,LN);
   SetIndexStyle(1,DRAW_HISTOGRAM);
   SetIndexBuffer(1,RedHist);
   SetIndexStyle(2,DRAW_HISTOGRAM);//DRAW_NONE
   SetIndexBuffer(2,GreenHist);
//----
   SetIndexBuffer(3,RWArr);
   SetIndexBuffer(4,PrePk);
   SetIndexBuffer(5,Pk);
   SetIndexBuffer(6,KCD);

   SetIndexDrawBegin(0,Periods+3+3+8+Periods);
   SetIndexDrawBegin(1,Periods+3+3+8+Periods);
   SetIndexDrawBegin(2,Periods+3+3+8+Periods);

   SqrtPer = MathSqrt(Periods);

   return(0);
  }

//+------------------------------------------------------------------+
//| Custom indicator iteration function                              |
//+------------------------------------------------------------------+
int start()
  {
   double rwh = 0;
   double rwl = 0;
   double mn = 0;
   double sd = 0;
   double val1 = 0;
   double val2 = 0;
   double atr = 0;
   int i;
   int    counted_bars=IndicatorCounted();
   //unted_bars = Bars - 100;
   if(counted_bars<0) return(-1);
   //---- last counted bar will be recounted
   if(counted_bars>0) counted_bars--;
   if(counted_bars>=Periods+3+3+8+Periods) counted_bars-=(Periods+3+3+8+Periods);
   if(counted_bars==0) {
      for(i=(Bars-1); i>=(Bars-1)-counted_bars-Periods-3-3-8-Periods+1; i--) {
         RWArr[i] = 0;
         PrePk[i] = 0;
         Pk[i] = 0;
         KCD[i] = 0;
         LN[i] = 0;
         RedHist[i] = 0;
         GreenHist[i] = 0;
      }
   }
// RWH:=(H-Ref(L,-Per1))/(ATR(Per1)*Sqrt(Per1));
// RWL:=(Ref(H,-Per1)-L)/(ATR(Per1)*Sqrt(Per1));
   for(i=(Bars-1)-counted_bars-Periods; i>=0; i--)
   {
      rwh = 0; rwl = 0;
      atr = iATR(NULL, 0, Periods,i)*SqrtPer;
      if(atr!=0){
         rwh = (High[i]-Low[i+Periods])/atr;
         rwl = (High[i+Periods]-Low[i])/atr;
      }
      RWArr[i] = rwh - rwl;
   }
// Pk:= Mov(Mov((RWH-RWL),3,W),3,S);
   for(i=(Bars-1)-counted_bars-Periods-3; i>=0; i--)
   {
      PrePk[i] = iMAOnArray(RWArr,Bars,3,0,MODE_LWMA,i);
   }
   for(i=(Bars-1)-counted_bars-Periods-3-3; i>=0; i--)
   {
      Pk[i] = iMAOnArray(PrePk,Bars,3,0,MODE_SMA,i);
   }
// KCD:= PK-Mov(PK,8,S);
   for(i=(Bars-1)-counted_bars-Periods-3-3-8; i>=0; i--)
   {
      KCD[i] = Pk[i]-iMAOnArray(Pk,Bars,8,0,MODE_SMA,i);
   }
   for(i=(Bars-1)-counted_bars-Periods-3-3-8-Periods; i>=0; i--)
   {
//    MN:= Mov(KCD,Per1,S);
//    SD:= Stdev(KCD,Per1);
      mn = iMAOnArray(KCD,Bars,Periods,0,MODE_SMA,i);
      sd = iStdDevOnArray(KCD,Bars,Periods,0,MODE_SMA,i);

//    Val1:= If(MN+(1.33*SD)>2.08,MN+(1.33*SD),2.08);
      if(mn+(1.33*sd)>2.08)
         val1 = mn+(1.33*sd);
      else
         val1 = 2.08;
//    Val2:= If(MN-(1.33*SD)<-1.92,MN-(1.33*SD),-1.92);
      if(mn-(1.33*sd)<-1.92)
         val2 = mn-(1.33*sd);
      else
         val2 = -1.92;

//    LN:= If(Ref(KCD,-1)>=0 AND KCD>0,Val1,If(Ref(KCD,-1)<=0 AND KCD<0,Val2,0));
      if(KCD[i+1]>=0 && KCD[i]>0)
         LN[i] = val1;
      else
         if(KCD[i+1]<=0 && KCD[i]<0)
            LN[i] = val2;
         else
            LN[i] = 0;

//    Red:= If(Ref(KCD,-1)>KCD,KCD,0);
      if(KCD[i+1]>KCD[i])
         RedHist[i] = KCD[i];
      else
         RedHist[i] = 0;

//    Green:= If(KCD>Ref(KCD,-1),KCD,0);
      if(KCD[i]>KCD[i+1])
         GreenHist[i] = KCD[i];
      else
         GreenHist[i] = 0;
   }

   return(0);
  }
//+------------------------------------------------------------------+
Sample
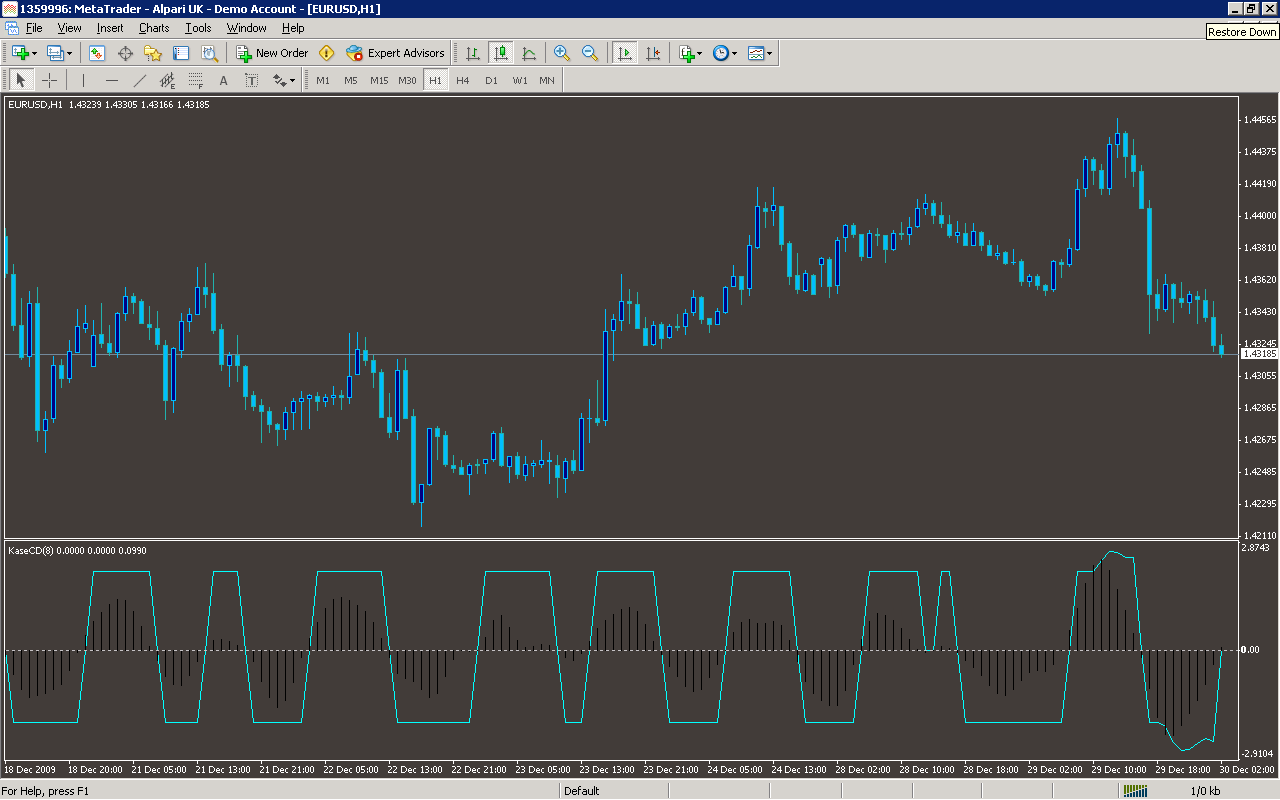
Analysis
Market Information Used:
Series array that contains the highest prices of each bar
Series array that contains the lowest prices of each bar
Indicator Curves created:
Implements a curve of type DRAW_LINE
Implements a curve of type DRAW_HISTOGRAM
Indicators Used:
Indicator of the average true range
Moving average indicator
Standard Deviation indicator
Custom Indicators Used:
Order Management characteristics:
Other Features: