//+------------------------------------------------------------------+
//|                                         KasePeakOscilator_v1.mq4 |
//|                                                          Kalenzo |
//|                                      bartlomiej.gorski@gmail.com |
//+------------------------------------------------------------------+
#property copyright "Kalenzo"
#property link      "bartlomiej.gorski@gmail.com"

#property indicator_buffers 3
#property indicator_color1 Green
#property indicator_color2 Red
#property indicator_color3 Yellow

extern int KPeriod = 30;
extern int BarsToCalculate = 300;
double RWHL[];

double Pk[];
double PkGreen[];
double PkRed[];

double MN[];
double SD[];
double v1,v2;
double Line[];

#property indicator_separate_window
//+------------------------------------------------------------------+
//| Custom indicator initialization function                         |
//+------------------------------------------------------------------+
int init()
  {
//---- indicators
   IndicatorBuffers(7);

   SetIndexStyle(0,DRAW_HISTOGRAM,EMPTY,1);
   SetIndexBuffer(0,PkGreen);

   SetIndexStyle(1,DRAW_HISTOGRAM,EMPTY,1);
   SetIndexBuffer(1,PkRed);

   SetIndexStyle(2,DRAW_LINE,EMPTY,1);
   SetIndexBuffer(2,Line);

   SetIndexBuffer(3,RWHL);
   SetIndexBuffer(4,MN);
   SetIndexBuffer(5,SD);
   SetIndexBuffer(6,Pk);


//----
   return(0);
  }
//+------------------------------------------------------------------+
//| Custom indicator deinitialization function                       |
//+------------------------------------------------------------------+
int deinit()
  {
//----

//----
   return(0);
  }
//+------------------------------------------------------------------+
//| Custom indicator iteration function                              |
//+------------------------------------------------------------------+
int start()
  {

//----


   int limit = BarsToCalculate;

//----


   for(int i = 0; i <= limit; i++)
   {
      double H = (High[i]-Low[i+KPeriod])/(iATR(Symbol(),0,KPeriod,i)*MathSqrt(KPeriod));
      double L = (High[i+KPeriod]-Low[i])/(iATR(Symbol(),0,KPeriod,i)*MathSqrt(KPeriod));

      RWHL[i] = H - L;
   }


   for(int p = 0; p <= limit; p++) Pk[p] = iMAOnArray(RWHL,0,3,0,MODE_LWMA,p);
   for(int m = 0; m <= limit; m++) MN[m] = iMAOnArray(Pk,0,KPeriod,0,MODE_SMA,m);
   for(int s = 0; s <= limit; s++) SD[s] = iStdDevOnArray(Pk,0,KPeriod,MODE_SMA,0,s);


   for(int v = 0; v <= limit; v++)
   {
      if(MN[v]+(1.33*SD[v])>2.08)
      v1 = MN[v]+(1.33*SD[v]);
      else
      v1 = 2.08;

      if(MN[v]-(1.33*SD[v])<-1.92)
      v2 = MN[v]-(1.33*SD[v]);
      else
      v2 = -1.92;

      if(Pk[v+1]>Pk[v])
      {
         PkRed[v] = Pk[v];
         PkGreen[v] = 0;
      }
      else
      {
         PkRed[v] = 0;
         PkGreen[v] = Pk[v];
      }


      if(Pk[v+1] >= 0 && Pk[v] > 0)
      {
         Line[v] = v1;
      }
      else
      {
         if(Pk[v+1] <= 0 && Pk[v] < 0)
         {
            Line[v] = v2;
         }
         else
         {
            Line[v] = 0;
         }
      }
   }

//----
   return(0);
  }
//+------------------------------------------------------------------+
Sample
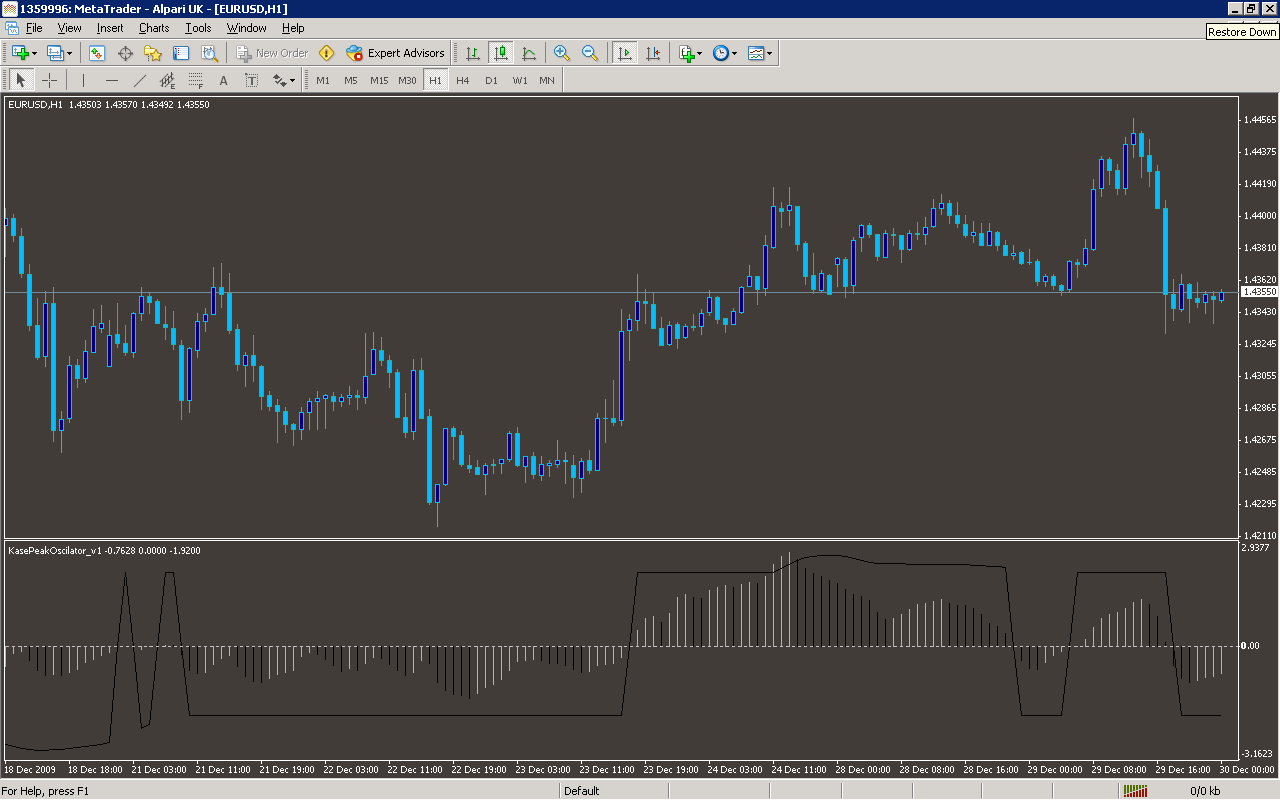
Analysis
Market Information Used:
Series array that contains the highest prices of each bar
Series array that contains the lowest prices of each bar
Indicator Curves created:
Implements a curve of type DRAW_HISTOGRAM
Implements a curve of type DRAW_LINE
Indicators Used:
Indicator of the average true range
Moving average indicator
Standard Deviation indicator
Custom Indicators Used:
Order Management characteristics:
Other Features: