//+------------------------------------------------------------------+
//|                                       Linear Regression Line.mq4 |
//+------------------------------------------------------------------+
#property copyright "MetaTrader 4"
#property link      "http://metatrader.com"
//---- indicator settings
#property indicator_chart_window
#property indicator_buffers 1
#property indicator_color1 Blue
#property indicator_width1 2
//---- input parameters
extern int LRLPeriod=21;
extern string  p = "--Applied Price Types--";
extern string  p0 = " 0 = close";
extern string  p1 = " 1 = open";
extern string  p2 = " 2 = high";
extern string  p3 = " 3 = low";
extern string  p4 = " 4 = median(high+low)/2";
extern string  p5 = " 5 = typical(high+low+close)/3";
extern string  p6 = " 6 = weighted(high+low+close+close)/4";
extern int       MAAppliedPrice = 0;
//---- buffers
double LRLBuffer[];

int shift=0;
int n=0;
double sumx=0, sumy=0, sumxy=0, sumx2=0, sumy2=0;
double m=0, yint=0, r=0;
//+------------------------------------------------------------------+
//| Custom indicator initialization function                         |
//+------------------------------------------------------------------+
int init()
  {
//---- indicators
   SetIndexStyle(0,DRAW_LINE);
   SetIndexBuffer(0,LRLBuffer);
   IndicatorDigits(Digits);
   if(LRLPeriod < 2) LRLPeriod = 2;
   IndicatorShortName("Linear Regression Line ("+LRLPeriod+")");
   SetIndexDrawBegin(0,LRLPeriod+2);
   IndicatorDigits(MarketInfo(Symbol(),MODE_DIGITS)+4);
//----
   return(0);
  }
//+------------------------------------------------------------------+
//| Custom indicator deinitialization function                       |
//+------------------------------------------------------------------+
int deinit()
  {
   return(0);
  }
//+------------------------------------------------------------------+
//| Linear Regression Line                                           |
//+------------------------------------------------------------------+
int start()
  {
   double myPrice;
   int limit;
   int counted_bars=IndicatorCounted();
   if(counted_bars<0) counted_bars=0;
   if(counted_bars>0) counted_bars--;
   limit=Bars-counted_bars;

   for(int shift=limit-1; shift>=0; shift--)
      {
         sumx = 0;
         sumy = 0;
         sumxy = 0;
         sumx2 = 0;
         sumy2 = 0;
         for(n = 0; n <= LRLPeriod-1; n++)
             {
               myPrice = Price(MAAppliedPrice, shift+n);
               sumx = sumx + n;
               sumy = sumy + myPrice;
               sumxy = sumxy + n * myPrice;
               sumx2 = sumx2 + n * n;
               sumy2 = sumy2 + myPrice * myPrice;
             }
         m=(LRLPeriod*sumxy-sumx*sumy)/(LRLPeriod*sumx2-sumx*sumx);
         yint=(sumy+m*sumx)/LRLPeriod;
         r=(LRLPeriod*sumxy-sumx*sumy)/MathSqrt((LRLPeriod*sumx2-sumx*sumx)*(LRLPeriod*sumy2-sumy*sumy));
         LRLBuffer[shift]=MathFloor((yint-m*LRLPeriod)/Point) * Point;
      }
   return(0);
  }

double Price(int prMode, int myShift)
{

   double pr;
   switch (prMode)
   {
     case 0: pr = Close[myShift];break;
     case 1: pr = Open[myShift];break;
     case 2: pr = High[myShift];break;
     case 3: pr = Low[myShift];break;
     case 4: pr = (High[myShift] + Low[myShift])/2;break;
     case 5: pr = (High[myShift] + Low[myShift] + Close[myShift])/3;break;
     case 6: pr = (High[myShift] + Low[myShift] + 2 * Close[myShift])/4;break;
   }

     return (pr);
}

//+------------------------------------------------------------------+
Sample
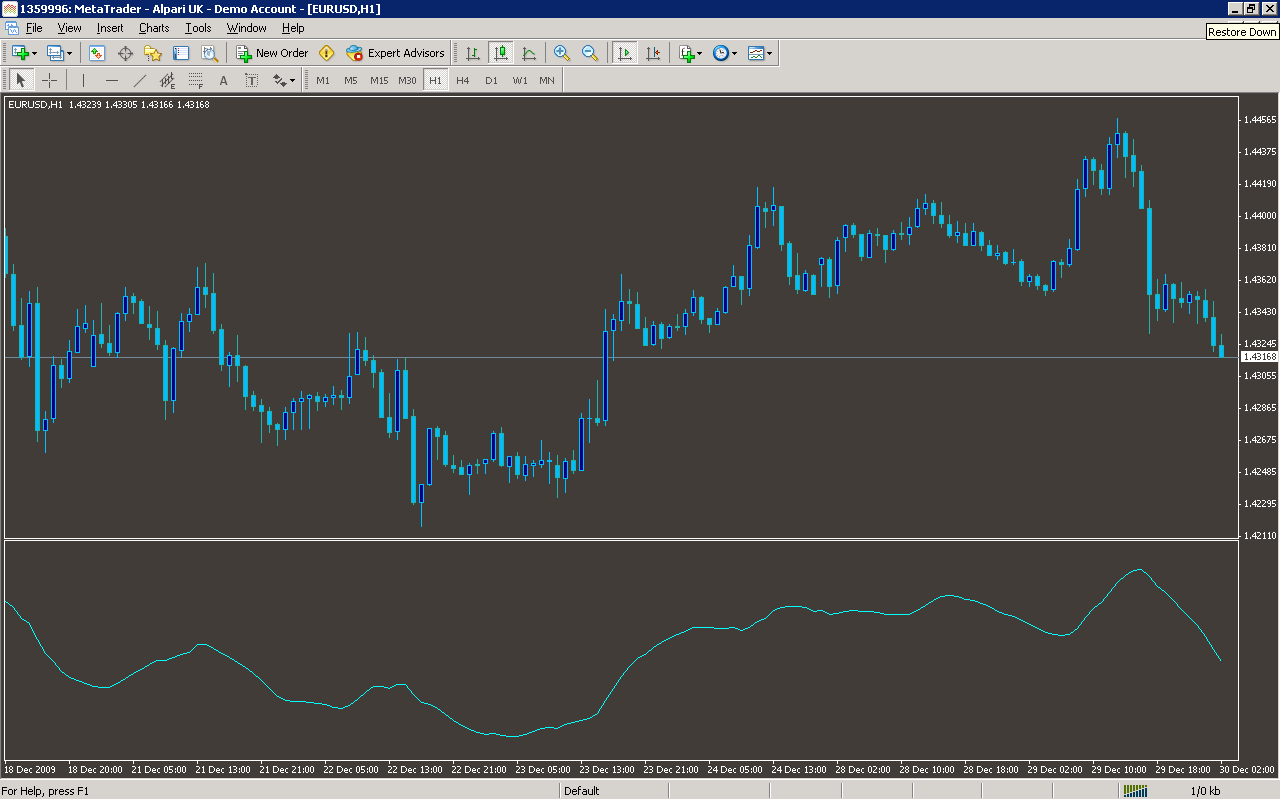
Analysis
Market Information Used:
Series array that contains close prices for each bar
Series array that contains open prices of each bar
Series array that contains the highest prices of each bar
Series array that contains the lowest prices of each bar
Indicator Curves created:
Implements a curve of type DRAW_LINE
Indicators Used:
Custom Indicators Used:
Order Management characteristics:
Other Features: