//+------------------------------------------------------------------+
//|                                                   Lsma.mq4       |
//|                                    Copyright © 2004, Robert Hill |
//|                                             http://www.fxdd.com/ |
//|                                                                  |
//| LSMA displays a line using the endpoint of                       |
//| the linear regression line                                       |
//+------------------------------------------------------------------+
#property  copyright "Copyright © 2004, Robert Hill"
#property  link      "http://www.fxdd.com/"

//---- indicator settings
#property  indicator_chart_window
#property  indicator_buffers 1
#property indicator_color1 Yellow
#property indicator_width1 2

extern int LSMA_Period = 14;
extern string  p = "--Applied Price Types--";
extern string  p0 = " 0 = close";
extern string  p1 = " 1 = open";
extern string  p2 = " 2 = high";
extern string  p3 = " 3 = low";
extern string  p4 = " 4 = median(high+low)/2";
extern string  p5 = " 5 = typical(high+low+close)/3";
extern string  p6 = " 6 = weighted(high+low+close+close)/4";
extern int     LSMA_AppliedPrice = 0;//0=close, 1=open, 2=high, 3=low, 4=median(high+low)/2, 5=typical(high+low+close)/3, 6=weighted(high+low+close+close)/4

//---- buffers
double LSMA_Buffer[];

//+------------------------------------------------------------------+
//| Custom indicator initialization function                         |
//+------------------------------------------------------------------+
int init()
  {

//---- drawing settings
   SetIndexBuffer(0,LSMA_Buffer);

   SetIndexStyle(0,DRAW_LINE,STYLE_SOLID);
   SetIndexLabel(0, "Lsma");
	IndicatorShortName("LSMA("+LSMA_Period+")");

//---- initialization done
   return(0);
  }

int start()

  {
   int    i, limit;
   int    counted_bars=IndicatorCounted();
   if(counted_bars>0) counted_bars--;
   limit=Bars-counted_bars;

   for(i = limit; i >= 0; i--)
        LSMA_Buffer[i] = LSMA(LSMA_Period, LSMA_AppliedPrice, i);

      return(0);
  }

//+------------------------------------------------------------------+
//| LSMA with PriceMode                                              |
//| PrMode  0=close, 1=open, 2=high, 3=low, 4=median(high+low)/2,    |
//| 5=typical(high+low+close)/3, 6=weighted(high+low+close+close)/4  |
//+------------------------------------------------------------------+

double LSMA(int Rperiod, int prMode, int shift)
{
   int i;
   double sum, pr;
   int length;
   double lengthvar;
   double tmp;
   double wt;

   length = Rperiod;

   sum = 0;
   for(i = length; i >= 1  ; i--)
   {
     lengthvar = length + 1;
     lengthvar /= 3;
     tmp = 0;
     switch (prMode)
     {
     case 0: pr = Close[length-i+shift];break;
     case 1: pr = Open[length-i+shift];break;
     case 2: pr = High[length-i+shift];break;
     case 3: pr = Low[length-i+shift];break;
     case 4: pr = (High[length-i+shift] + Low[length-i+shift])/2;break;
     case 5: pr = (High[length-i+shift] + Low[length-i+shift] + Close[length-i+shift])/3;break;
     case 6: pr = (High[length-i+shift] + Low[length-i+shift] + Close[length-i+shift] + Close[length-i+shift])/4;break;
     }
     tmp = ( i - lengthvar)*pr;
     sum+=tmp;
    }
    wt = NormalizeDouble((sum*6)/(length*(length+1)),Digits);

    return(wt);
}

//+------------------------------------------------------------------+
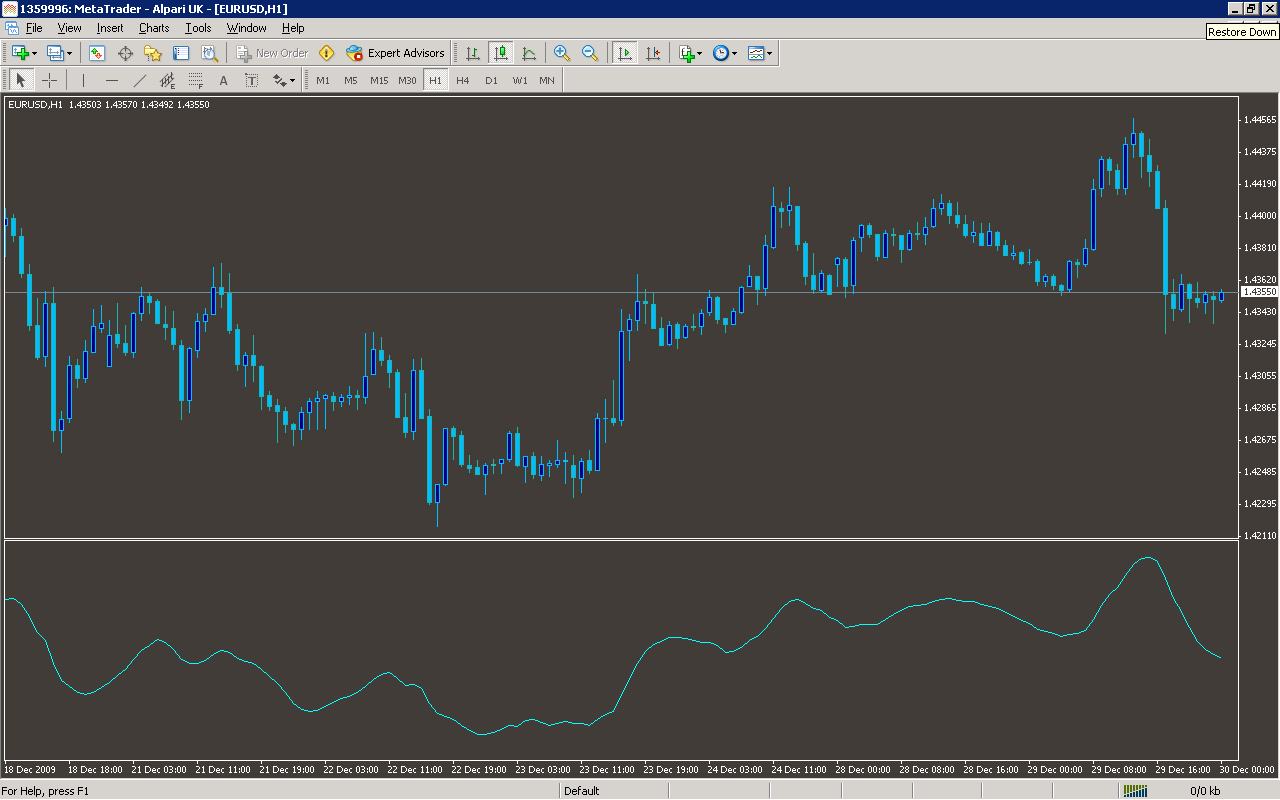
Sample
Analysis
Market Information Used:
Series array that contains close prices for each bar
Series array that contains open prices of each bar
Series array that contains the highest prices of each bar
Series array that contains the lowest prices of each bar
Indicator Curves created:
Implements a curve of type DRAW_LINE
Indicators Used:
Custom Indicators Used:
Order Management characteristics:
Other Features: