//+------------------------------------------------------------------+
//|                                                  Min_Max_RSI.mq4 |
//|                   Copyright © 2007, 4/Mar/2007 David W Honeywell |
//|                                     hellonwheels.trans@gmail.com |
//+------------------------------------------------------------------+
#property copyright "Copyright © 2007, 4/Mar/2007 David W Honeywell"
#property link      "hellonwheels.trans@gmail.com"

#property indicator_separate_window
#property indicator_minimum 0
#property indicator_maximum 100

#property indicator_buffers 2
#property indicator_color1 Lime
#property indicator_color2 Red

extern int RsiPeriods = 14,ShowBars = 500;

double Hrsi;
double Lrsi;

double TopArrow[];
double BottomArrow[];

//+------------------------------------------------------------------+
//| Custom indicator initialization function                         |
//+------------------------------------------------------------------+

int init()
  {
//---- indicators

   SetIndexStyle(0,DRAW_LINE);
   SetIndexEmptyValue(0,0.0);
   SetIndexBuffer(0,TopArrow);

   SetIndexStyle(1,DRAW_LINE);
   SetIndexEmptyValue(1,0.0);
   SetIndexBuffer(1,BottomArrow);

//----
   return(0);
  }
//+------------------------------------------------------------------+
//| Custom indicator deinitialization function                       |
//+------------------------------------------------------------------+
int deinit()
  {
//----

//----
   return(0);
  }
//+------------------------------------------------------------------+
//| Custom indicator iteration function                              |
//+------------------------------------------------------------------+
int start()
  {
   int    counted_bars=IndicatorCounted();
//----

   for ( int shift = ShowBars; shift > 0; shift-- )
    {
     if (iRSI(Symbol(),0,RsiPeriods,PRICE_CLOSE,shift) <= 50.0000) { Hrsi = 50.0000; }
     if (iRSI(Symbol(),0,RsiPeriods,PRICE_CLOSE,shift) > 50.0000 && iRSI(Symbol(),0,RsiPeriods,PRICE_CLOSE,shift) >= Hrsi) { Hrsi = iRSI(Symbol(),0,RsiPeriods,PRICE_CLOSE,shift); }
     if (iRSI(Symbol(),0,RsiPeriods,PRICE_CLOSE,shift) >= 50.0000) { Lrsi = 50.0000; }
     if (iRSI(Symbol(),0,RsiPeriods,PRICE_CLOSE,shift) < 50.0000 && iRSI(Symbol(),0,RsiPeriods,PRICE_CLOSE,shift) <= Lrsi) { Lrsi = iRSI(Symbol(),0,RsiPeriods,PRICE_CLOSE,shift); }

     TopArrow[shift]    = Hrsi;
     BottomArrow[shift] = Lrsi;
    }

//----
   return(0);
  }
//+------------------------------------------------------------------+
Sample
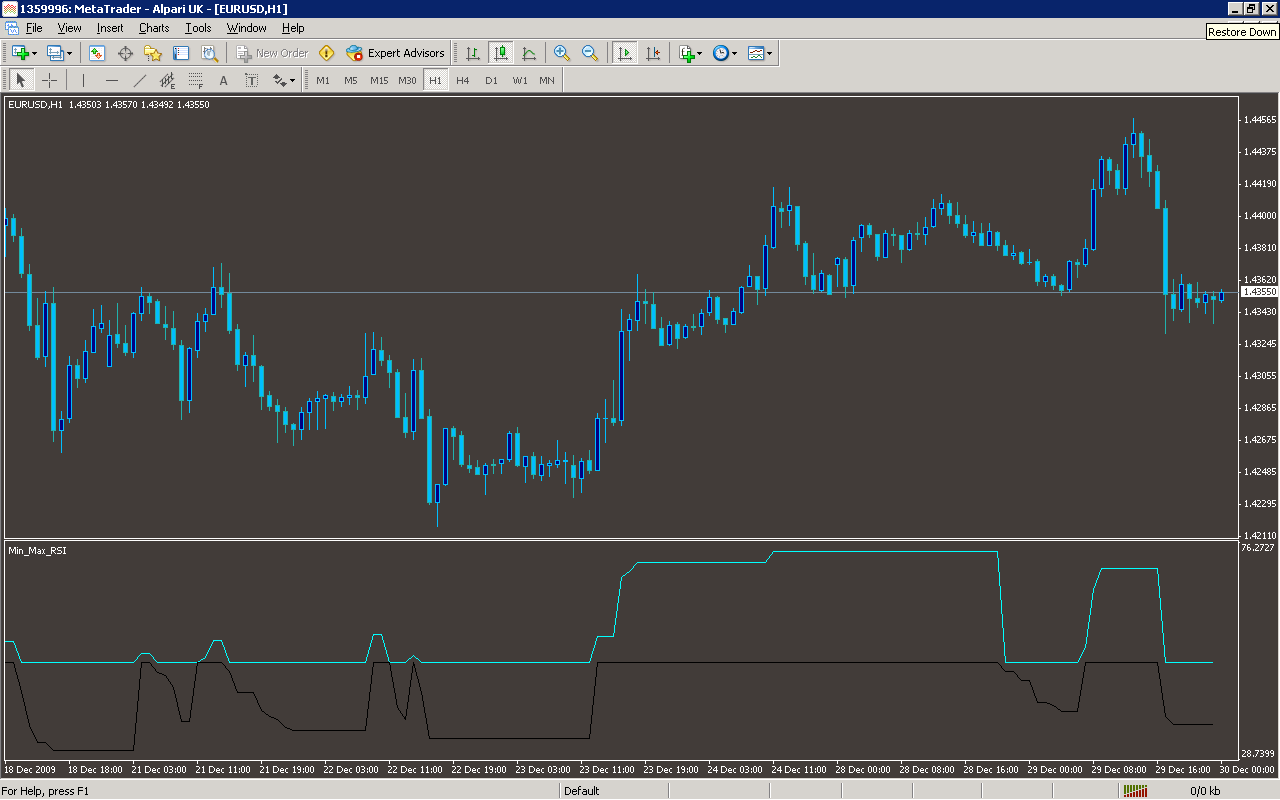
Analysis
Market Information Used:
Indicator Curves created:
Implements a curve of type DRAW_LINE
Indicators Used:
Relative strength index
Custom Indicators Used:
Order Management characteristics:
Other Features: