//+------------------------------------------------------------------+
//|                                          NeutralHedge osc_v1.mq4 |
//|                                            © 2008.07.02 SwingMan |
//|                                                                  |
//+------------------------------------------------------------------+
#property copyright "© 2008.07.02 SwingMan"
#property link      ""
// source code:
//+------------------------------------------------------------------+
//|                                       OverLay Chart.mq4 Ver.1.10 |
//|                                      Copyright© 2006-2007 S.B.T. |
//|                                     http://sufx.core.t3-ism.net/ |
//+------------------- DO NOT REMOVE THIS HEADER --------------------+
//|  This script is free to use/distribute/modify and re-distribute. |
//|                                  (Limited to noncommercial use.) |
//+------------------------------------------------------------------+
// changes:
//+------------------------------------------------------------------+
// - fewhills  / 2008.07.02
// I have modified the indicator with 2 extra parameters: starting time and TF period.
// The time parameter is the usual MT4 method: yyyy.mm.dd hh:mm
// The TF period is default at 1 Hr TF = 60
//+------------------------------------------------------------------+
// - SwingMan / 2008.07.02
// draw histogram of ratios
//+------------------------------------------------------------------+

#property indicator_separate_window
#property indicator_buffers 2

#property indicator_color1 MediumSeaGreen
#property indicator_color2 Tomato

#property indicator_level1 0
#property indicator_levelcolor Gray
#property indicator_levelstyle STYLE_SOLID

//---- inputs --------------------------------------------------------
extern string SubSymbol = "EURUSD";
extern string StartingTimeCorr = "2008.07.01 00:00";
extern int    TFperiod         = 60;
extern double threshold = 70;
extern color threshold_color = Magenta;
extern bool Mirroring = true;
//--------------------------------------------------------------------

string sWinName = "NeutralHedge osc_v1";

//Indicator Buffers
double ExtMapBuffer1[];
double ExtMapBuffer2[];

//-- variables
double dPoint;
int iWindow = 1;

//+------------------------------------------------------------------+
//| Custom indicator initialization function                         |
//+------------------------------------------------------------------+
int init()
{
   dPoint = MarketInfo(Symbol(), MODE_POINT);

   sWinName = sWinName + " (" + Symbol() + "-" + SubSymbol + ") ";
   IndicatorShortName(sWinName);

   SetIndexBuffer( 0, ExtMapBuffer1 );
   SetIndexBuffer( 1, ExtMapBuffer2 );

   SetIndexStyle( 0, DRAW_HISTOGRAM, STYLE_SOLID, 2);
   SetIndexStyle( 1, DRAW_HISTOGRAM, STYLE_SOLID, 2);

   SetIndexEmptyValue( 0, 0.0 );
   SetIndexEmptyValue( 1, 0.0 );

   SetIndexLabel( 0, "BUY -" +Symbol() );
   SetIndexLabel( 1, "SELL-" +Symbol() );

   IndicatorDigits(Digits);

   Draw_ThresholdLines();

   return(0);
}


//+------------------------------------------------------------------+
//| Custom indicator deinitialization function                       |
//+------------------------------------------------------------------+
int deinit()
{
   return(0);
}

//+------------------------------------------------------------------+
//| Custom indicator iteration function                              |
//+------------------------------------------------------------------+
int start()
{
   int _BarsCount;
   double _CurRangeHigh, _CurRangeLow, _CurRangeCenter, _CurClose;
   double _SubRangeHigh, _SubRangeLow, _SubRangeCenter;
   double _SubPoint, _SubDigit;
   double _SubOpen, _SubHigh, _SubLow, _SubClose;
   double _PipsRatio;
   double _GridPips, _GridPrice;
   int _i;

   int firstBar = iBarShift(NULL,TFperiod,StrToTime(StartingTimeCorr),true);
   if (firstBar <0 )
   {
      Alert("StartingTimeCorr seems to be wrong."); return (0);
   }

   //-- Initialize Buffers
	RefreshRates();
   ArrayInitialize( ExtMapBuffer1, 0.0 );
   ArrayInitialize( ExtMapBuffer2, 0.0 );

   //-- Calculate Visible Bars
   _BarsCount = WindowBarsPerChart() + 1;
   int _FirstBar = firstBar; // WindowFirstVisibleBar();
   int _LastBar = _FirstBar - _BarsCount + 1;
   if ( _LastBar < 0 ) {
      _LastBar = 0;
      _BarsCount = _FirstBar + 1;
   }


   //-- Calculate Chart Ratio
   _CurRangeHigh = High[Highest(Symbol(), 0, MODE_HIGH, _BarsCount, _LastBar)];
   _CurRangeLow  = Low[Lowest(Symbol(), 0, MODE_LOW, _BarsCount, _LastBar)];
   _CurRangeCenter = ( _CurRangeHigh + _CurRangeLow ) * 0.5;

   if ( Mirroring ) {
      _SubRangeHigh = iLow( SubSymbol, 0, Lowest( SubSymbol, 0, MODE_LOW, _BarsCount, _LastBar ) );
      _SubRangeLow  = iHigh( SubSymbol, 0, Highest( SubSymbol, 0, MODE_HIGH, _BarsCount, _LastBar ) );
   } else {
      _SubRangeHigh = iHigh( SubSymbol, 0, Highest( SubSymbol, 0, MODE_HIGH, _BarsCount, _LastBar ) );
      _SubRangeLow  = iLow( SubSymbol, 0, Lowest( SubSymbol, 0, MODE_LOW, _BarsCount, _LastBar ) );
   }

   _SubRangeCenter = ( _SubRangeHigh + _SubRangeLow ) * 0.5;
   _SubPoint = MarketInfo( SubSymbol, MODE_POINT );
   _SubDigit = MarketInfo( SubSymbol, MODE_DIGITS );

   _PipsRatio = ( _CurRangeHigh - _CurRangeLow )  / ( _SubRangeHigh - _SubRangeLow );

   //-- Draw ratio
	for ( _i = _LastBar; _i < _LastBar + _BarsCount; _i ++ ) {
      _SubClose = iClose( SubSymbol, 0, _i ) - _SubRangeCenter;

      double Close_Sub = _CurRangeCenter + _SubClose * _PipsRatio;
      double Close_Main = iClose(Symbol(), 0, _i);
      double range = (Close_Main - Close_Sub) / dPoint;
      range = NormalizeDouble(range,0);

      if (range > 0)
        ExtMapBuffer2[_i] = range;
      else
        ExtMapBuffer1[_i] = range;
   }
//----
   return(0);
}
//+------------------------------------------------------------------+

void Draw_ThresholdLines()
{
   iWindow = WindowFind(sWinName);
   Draw_Line("threshLineUp",  threshold, threshold_color);
   Draw_Line("threshLineDn", -threshold, threshold_color);
   return;
}

void Draw_Line(string sName, double value, color iColor)
{
   ObjectCreate(sName, OBJ_HLINE, iWindow, 0, value);
   ObjectSet(sName, OBJPROP_COLOR, iColor);
   ObjectSet(sName, OBJPROP_STYLE, STYLE_SOLID);
   ObjectSet(sName, OBJPROP_TIME1, 0);
   ObjectSet(sName, OBJPROP_PRICE1, value);
   return;
}
Sample
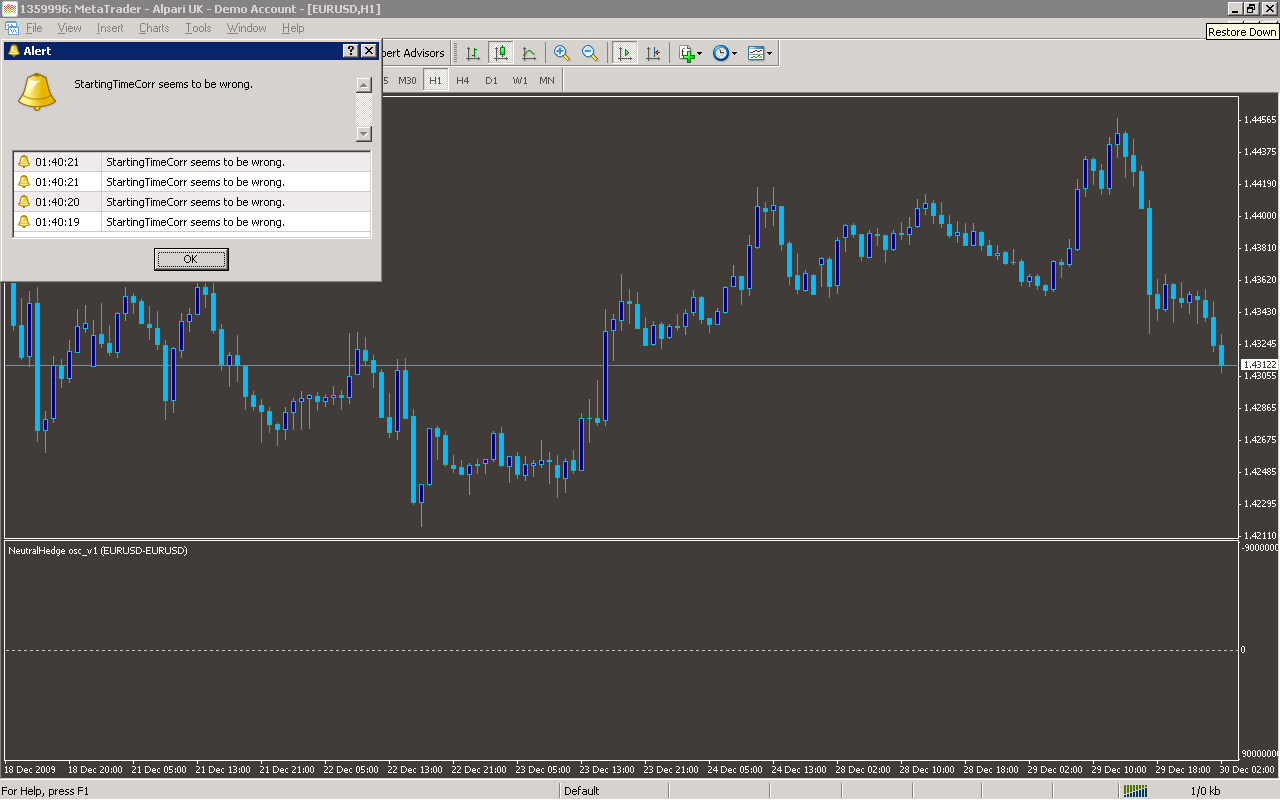
Analysis
Market Information Used:
Series array that contains the highest prices of each bar
Series array that contains the lowest prices of each bar
Series array that contains close prices for each bar
Indicator Curves created:
Implements a curve of type DRAW_HISTOGRAM
Indicators Used:
Custom Indicators Used:
Order Management characteristics:
Other Features:
It issuies visual alerts to the screen