//+------------------------------------------------------------------+
//+                                                                  +
//+------------------------------------------------------------------+
#property indicator_chart_window
#property indicator_buffers 2
#property indicator_color1 Blue
#property indicator_color2 Green

extern int DeepBars=1000;
//---- buffers
double ExtMapBuffer1[];
double ExtMapBuffer2[];
//+------------------------------------------------------------------+
//| Custom indicator initialization function                         |
//+------------------------------------------------------------------+
int init()
  {
   IndicatorShortName("Demark");
//---- indicators
//   SetIndexStyle(0,DRAW_ARROW);
   SetIndexStyle(0,DRAW_SECTION);
   SetIndexBuffer(0,ExtMapBuffer1);
   SetIndexEmptyValue(0,0.0);
   SetIndexBuffer(1,ExtMapBuffer2);
   SetIndexStyle(1,DRAW_ARROW,EMPTY,4);
   SetIndexArrow(1,159);
//   SetLevelStyle(STYLE_SOLID, 5, Green);
   SetIndexEmptyValue(0,0.0);
//----
   return(0);
  }
//+------------------------------------------------------------------+
//| Accumulation/Distribution                                        |
//+------------------------------------------------------------------+
int start()
  {
   int i;
//----
   i=DeepBars;
   for(i=1;i<=DeepBars;i++)
    {
     if (((iClose(Symbol(),0,i)>iClose(Symbol(),0,i+1)) && (iClose(Symbol(),0,i+2)>iClose(Symbol(),0,i+1)) && (iClose(Symbol(),0,i+3)>iClose(Symbol(),0,i+2))) &&
        ((iLow(Symbol(),0,i)>iLow(Symbol(),0,i+1)) && (iLow(Symbol(),0,i+2)>iLow(Symbol(),0,i+1)) && (iLow(Symbol(),0,i+3)>iLow(Symbol(),0,i+2))))
      {
       ExtMapBuffer2[i-1]=iLow(Symbol(),0,i-1)-5*Point;
       ExtMapBuffer1[i+1]=iLow(Symbol(),0,i+1);
      }
      if (((iClose(Symbol(),0,i)<iClose(Symbol(),0,i+1)) && (iClose(Symbol(),0,i+2)<iClose(Symbol(),0,i+1)) && (iClose(Symbol(),0,i+3)<iClose(Symbol(),0,i+2))) &&
        ((iHigh(Symbol(),0,i)<iHigh(Symbol(),0,i+1)) && (iHigh(Symbol(),0,i+2)<iHigh(Symbol(),0,i+1)) && (iHigh(Symbol(),0,i+3)<iHigh(Symbol(),0,i+2))))
      {
       ExtMapBuffer2[i-1]=iHigh(Symbol(),0,i-1)+5*Point;
       ExtMapBuffer1[i+1]=iHigh(Symbol(),0,i+1);
      }
    }
//----
   return(0);
  }
//+------------------------------------------------------------------+
Sample
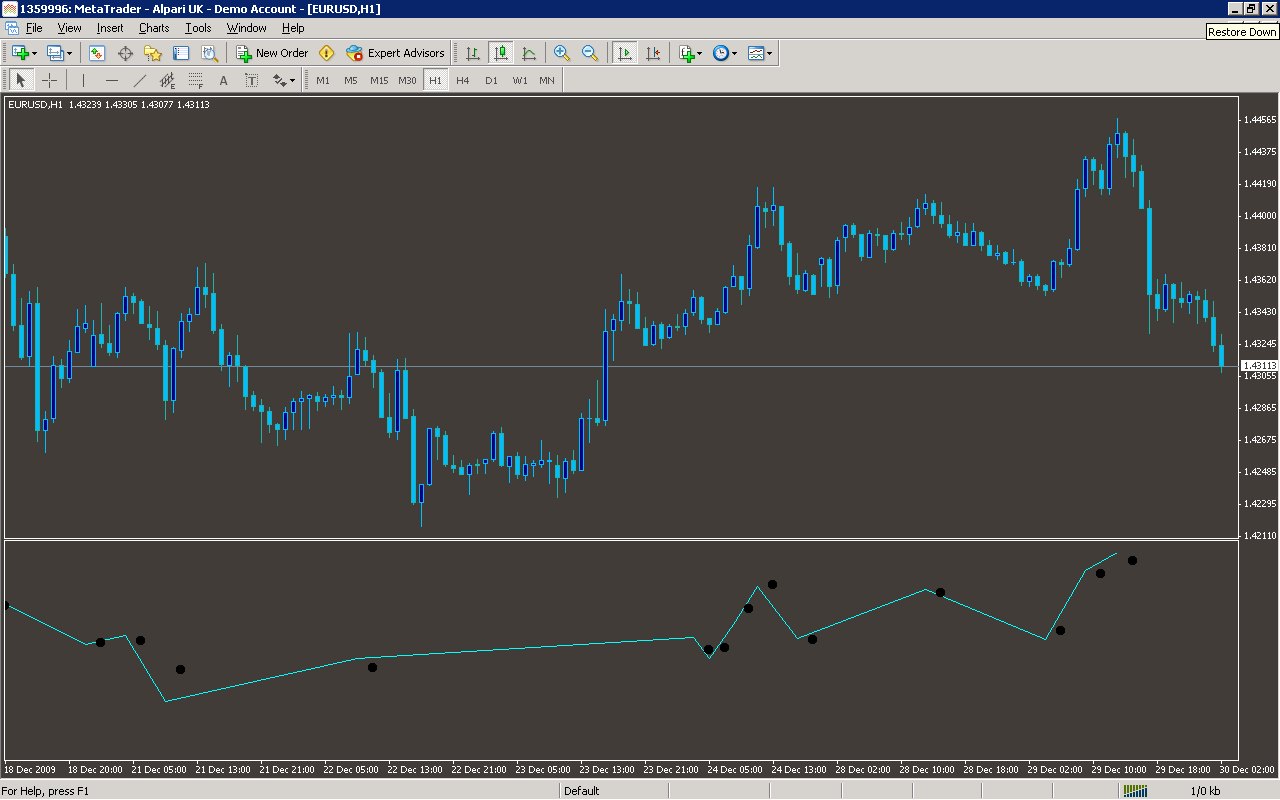
Analysis
Market Information Used:
Series array that contains close prices for each bar
Series array that contains the lowest prices of each bar
Series array that contains the highest prices of each bar
Indicator Curves created:
Implements a curve of type DRAW_SECTION
Implements a curve of type DRAW_ARROW
Indicators Used:
Custom Indicators Used:
Order Management characteristics:
Other Features: