//+------------------------------------------------------------------+
//|                                                R2_Arrows_v4a.mq4 |
//|           Copyright © 2007 , transport_david , David W Honeywell |
//|                                     hellonwheels.trans@gmail.com |
//+------------------------------------------------------------------+

#property copyright "Copyright © 2007 , transport_david , David W Honeywell"
#property link      "hellonwheels.trans@gmail.com"

#property indicator_chart_window

#property indicator_buffers 3

#property indicator_color1 DeepSkyBlue
#property indicator_color2 Red
#property indicator_color3 LawnGreen


extern string s1 = "---------------";
extern int    Ma_Periods          =     200;  // 200 day
extern int    Ma_Method           =       0;  // SMA
extern int    Ma_Applied_Price    =       1;  // Open

extern string s2 = "---------------";
extern int    RsiPeriods          =       2;  // 2 period
extern int    Rsi_Applied_Price   =       1;  // Open

extern string s3 = "---------------";
extern int    BuyIfDay1RsiBelow   =      65; // 1st day of tracking must be < this setting
extern int    BuyIfDay3RsiBelow   =      65; // 3rd day must be < this setting

extern string s4 = "---------------";
extern int    SellIfDay1RsiAbove  =      35; // 1st day of tracking must be > this setting
extern int    SellIfDay3RsiAbove  =      35; // 3rd day must be > this setting

extern string s5 = "---------------";
extern int    ShowBars            =   1000;

double MA[];
double Sell_Arrow[];
double Buy_Arrow[];
double Close_Trade_Marker[];

double bartime;


//+-------------+
//| Init        |
//+-------------+
int init()
  {
   IndicatorBuffers(5);

   SetIndexStyle(0,DRAW_LINE,STYLE_SOLID,2);
   SetIndexEmptyValue(0,0.0);
   SetIndexBuffer(0,MA);
   SetIndexLabel(0,"Trend_Ma_Periods ( "+Ma_Periods+" )");

   SetIndexEmptyValue(1,0.0);
   SetIndexStyle(1,DRAW_ARROW,STYLE_SOLID,1);
   SetIndexArrow(1,234);
   SetIndexBuffer(1,Sell_Arrow);
   SetIndexLabel(1,"Sell_Arrow ( RsiPeriods "+RsiPeriods+" )");

   SetIndexEmptyValue(2,0.0);
   SetIndexStyle(2,DRAW_ARROW,STYLE_SOLID,1);
   SetIndexArrow(2,233);
   SetIndexBuffer(2,Buy_Arrow);
   SetIndexLabel(2,"Buy_Arrow ( RsiPeriods "+RsiPeriods+" )");

   Print("Init complete");
  }


//+-------------+
//| De-init     |
//+-------------+
int deinit()
  {
   Print("De-init complete");
  }

//+-------------+
//| Start       |
//+-------------+
int start()
  {

   double    Today;
   double    Day1;
   double    Day2;
   double    Day3;
   double    sto;

   bool      C1, C2, C3, C4, C5, C6;

   int       shift;

   // bar counting
   if(bartime==Time[0]) return(0);
   bartime=Time[0];

   for ( shift = ShowBars; shift >= 0; shift-- )
     {

      //MA[shift] = iMA( Symbol(), 0, Ma_Periods, 0, Ma_Method, Ma_Applied_Price, shift);

      Day1  = iRSI(Symbol(),0,RsiPeriods,Rsi_Applied_Price,shift+3);
      Day2  = iRSI(Symbol(),0,RsiPeriods,Rsi_Applied_Price,shift+2);
      Day3  = iRSI(Symbol(),0,RsiPeriods,Rsi_Applied_Price,shift+1);
      //Today = iRSI(Symbol(),0,RsiPeriods,Rsi_Applied_Price,shift);
      sto   = iStochastic(Symbol(),0,5,3,3,MODE_SMA,1,MODE_MAIN,shift);

      //- Buy Arrows ---
      C1=false;
      C2=false;
      C3=false;
      C4=false;
      C5=false;
      C6=false;
      C1=true; //if(iOpen(Symbol(),0,shift+1) > MA[shift+1]) C1=true;
      if(Day1 < BuyIfDay1RsiBelow)                C2=true;
      if(Day2 < Day1)                             C3=true;
      if(Day3 < Day2)                             C4=true;
      if(Day3 < BuyIfDay3RsiBelow)                C5=true;
      if(sto  > 50)                               C6=true;
      if(C1&&C2&&C3&&C4&&C5&&C6) Buy_Arrow[shift] = iHigh(Symbol(),0,shift) + (20*Point); // Low arrow Buy

      //- Sell Arrows ---
      C1=false;
      C2=false;
      C3=false;
      C4=false;
      C5=false;
      C6=false;
      C1=true;//if(iOpen(Symbol(),0,shift+1) < MA[shift+1]) C1=true;
      if(Day1 > SellIfDay1RsiAbove)               C2=true;
      if(Day2 > Day1)                             C3=true;
      if(Day3 > Day2)                             C4=true;
      if(Day3 > SellIfDay3RsiAbove)               C5=true;
      if(sto  < 50)                               C6=true;
      if(C1&&C2&&C3&&C4&&C5&&C6) Sell_Arrow[shift] = iLow(Symbol(),0,shift) - (20*Point); // High arrow Sell

     }//for

  }//start
Sample
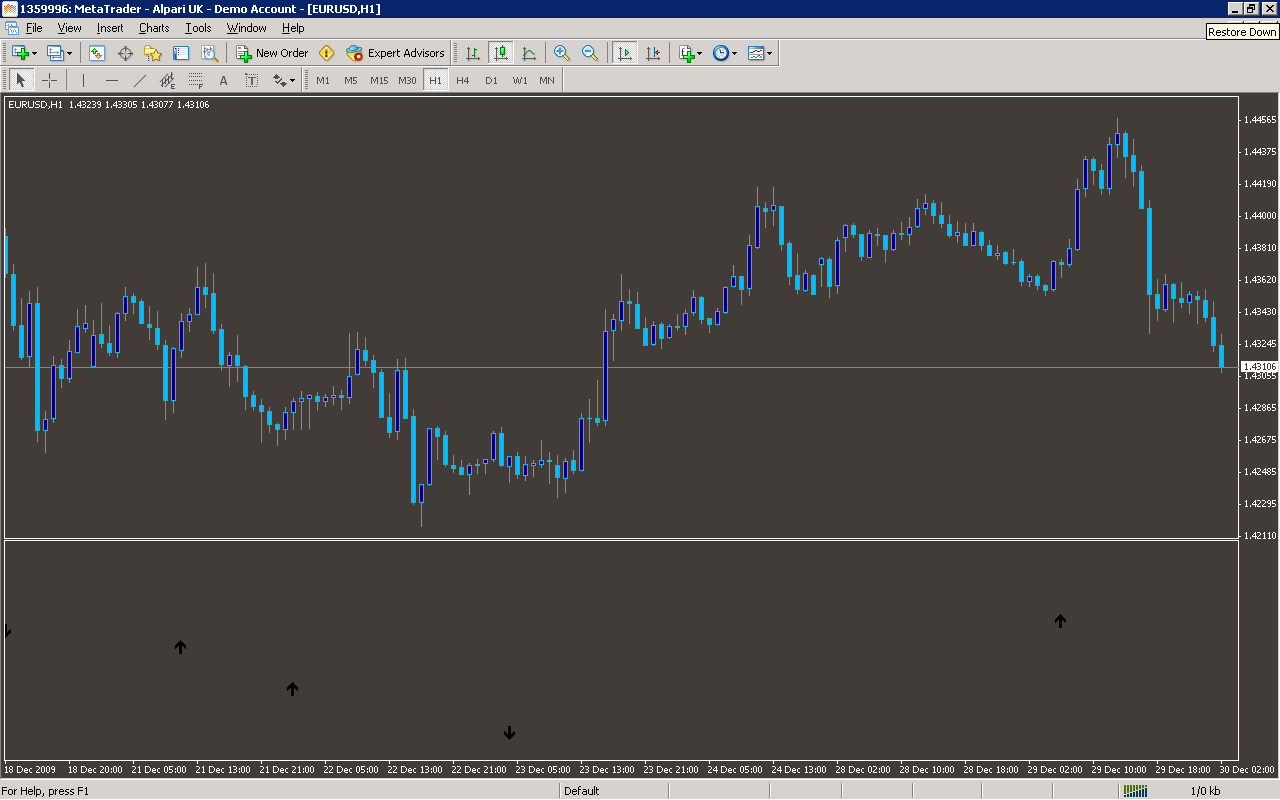
Analysis
Market Information Used:
Series array that contains open time of each bar
Series array that contains the highest prices of each bar
Series array that contains the lowest prices of each bar
Indicator Curves created:
Implements a curve of type DRAW_LINE
Implements a curve of type DRAW_ARROW
Indicators Used:
Relative strength index
Stochastic oscillator
Custom Indicators Used:
Order Management characteristics:
Other Features: