//+------------------------------------------------------------------+
//| RSI_Trend.mq4 |
//| Copyright © 2008, Robert Hill. |
//| |
//| RSI Trend based on method described at
//|
//| http://scientifictrader.com/stock_trend.htm
//|
//| Up Trend
//|
//| For starters, we will use a 9 period RSI.
//| The first step is to determine how many periods have passed
//| since the RSI went above 70 and how many periods have passed
//| since it went below 30.
//|
//| If there have been fewer periods since it was above 70,
//| then we check to see if the lowest value of RSI since that
//| point is still above 40. If this is the case,
//| then we have a confirmed up trend.
//| It began when the RSI value first exceeded 70 and continues
//| so long as the lowest RSI value stays above 40.
//|
//| Down Trend
//|
//| To identify a down trend, again we use a 9 period RSI.
//| Then we determine how many periods have gone by since
//| the RSI went above 70 and how many periods have passed
//| since it went below 30.
//|
//| If there have been fewer periods since it was below 30,
//| then we check to see if the highest value of RSI since that
//| point is still below 60. If this is the case then we have
//| a confirmed down trend.
//| It began when the RSI value first fell below 30 and continues
//| so long as the highest RSI value stays below 60.
//|
//| Trading Range
//|
//| The trading range is simple to detect.
//| We find it be default. When an up trend ends,
//| but a down trend is not detected by the above criteria,
//| a trading range has been established.
//| Of course, the opposite is true too.
//| When a down trend ends, but an uptrend does not show itself,
//| a trading range has been established.
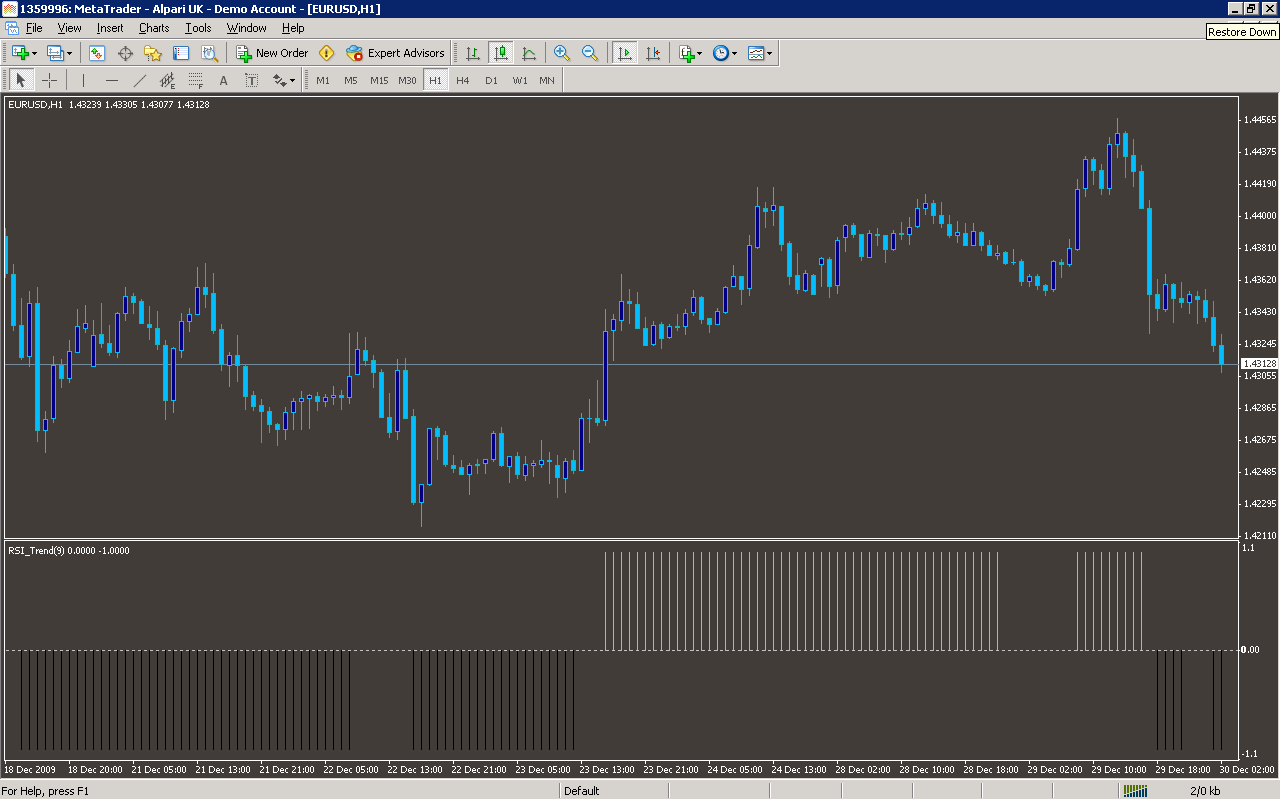
//| The bottom window displaying green and red vertical bars
//| indicate up and down stock trends respectively.
//| The same window, when neither green or red bars are present,
//| indicate a trading range.
//| These bars are based upon the RSI requirements we have noted above.
//| Notice how each time the trend indicating bars precede significant
//| price movements in the stock, allowing you to take advantage of them.
//| Additionally, when no trend bars are present (a trading range),
//| no significant price movement occurs in the stock.
//| Imagine the advantage you would have over other traders in the
//| market if you know beforehand the trend in a stock was about to shift!
//+------------------------------------------------------------------+
#property copyright "Copyright © 2008, Robert Hill."
#property link ""
#property indicator_separate_window
#property indicator_buffers 2
#property indicator_color1 Green
#property indicator_color2 Red
//---- input parameters
extern int RSI_Period=9;
//---- buffers
double HistogramBufferUp[];
double HistogramBufferDown[];
//+------------------------------------------------------------------+
//| Custom indicator initialization function |
//+------------------------------------------------------------------+
int init()
{
string short_name;
SetIndexStyle(0,DRAW_HISTOGRAM,STYLE_SOLID);
SetIndexBuffer(0,HistogramBufferUp);
SetIndexStyle(1,DRAW_HISTOGRAM,STYLE_SOLID);
SetIndexBuffer(1,HistogramBufferDown);
//---- name for DataWindow and indicator subwindow label
short_name="RSI_Trend("+RSI_Period+")";
IndicatorShortName(short_name);
SetIndexLabel(0,short_name);
//----
SetIndexDrawBegin(0,RSI_Period);
//----
return(0);
}
//+------------------------------------------------------------------+
//| Relative Strength Index |
//+------------------------------------------------------------------+
int start()
{
bool upTrend, downTrend;
int i,limit,counted_bars=IndicatorCounted();
double temp;
//----
if(counted_bars<0) return(-1);
//----
//---- last counted bar will be recounted
if(counted_bars>0) counted_bars--;
limit=Bars-counted_bars;
for( i=limit; i>=0; i--)
{
HistogramBufferUp[i] = 0;
HistogramBufferDown[i] = 0;
temp = iRSI(NULL, 0, RSI_Period, PRICE_CLOSE, i);
if (temp >= 70) upTrend = true;
if (temp < 40) upTrend = false;
if (temp <= 30) downTrend = true;
if (temp > 60) downTrend = false;
if (upTrend == true) HistogramBufferUp[i] = 1;
if (downTrend == true) HistogramBufferDown[i] = -1;
}
//----
return(0);
}
//+------------------------------------------------------------------+
Sample
Analysis
Market Information Used:
Indicator Curves created:
Implements a curve of type DRAW_HISTOGRAM
Indicators Used:
Relative strength index
Custom Indicators Used:
Order Management characteristics:
Other Features: