//+------------------------------------------------------------------+
//|                                                    RSIArrows.mq4 |
//+------------------------------------------------------------------+
#property copyright ""
#property link      ""

#property indicator_chart_window
#property indicator_buffers 2
#property indicator_color1 Blue
#property indicator_color2 Red

extern double  Over.Sold=30.0;
extern double  Over.Bought=70.0;
extern int     RSI.Period=14;
extern bool    Show.Forming.Bar=true;

double         CrossUp[];
double         CrossDown[];
double         Offset=0.003;
int            Start.Value=1;

//+------------------------------------------------------------------+
int init()
   {
   SetIndexStyle(0, DRAW_ARROW, EMPTY);      //Set up buffers for Up & Down Arrows
   SetIndexArrow(0, 233);
   SetIndexBuffer(0, CrossUp);
   SetIndexStyle(1, DRAW_ARROW, EMPTY);
   SetIndexArrow(1, 234);
   SetIndexBuffer(1, CrossDown);
   if(Digits==2) Offset=0.3;                 //For the JPY's
   if(Show.Forming.Bar) Start.Value=0;       //Show if OverSold or OverBought on forming bar even if
   return(0);                                //it may change before the bar is closed.
  }
//+------------------------------------------------------------------+
int start()
  {
   int    counted_bars=IndicatorCounted();
   double cRSI=0;
   for(int i=Start.Value;i<Bars-counted_bars;i++)
      {
      cRSI=iRSI(NULL,0,14,PRICE_CLOSE,i);
      if (cRSI>Over.Bought) CrossDown[i] = High[i]+Offset;
      if(cRSI<Over.Sold) CrossUp[i] = Low[i]-Offset;
      }
   return(0);
  }
//+------------------------------------------------------------------+
Sample
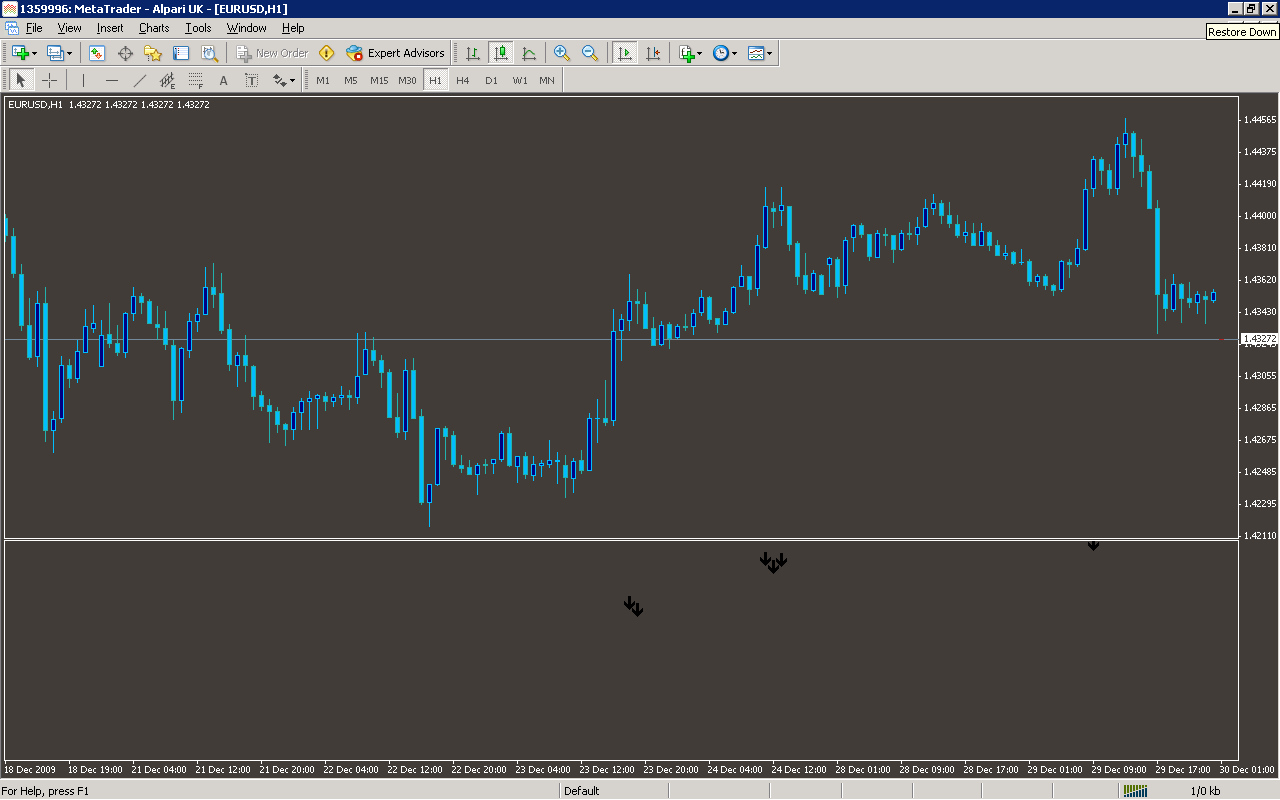
Analysis
Market Information Used:
Series array that contains the highest prices of each bar
Series array that contains the lowest prices of each bar
Indicator Curves created:
Implements a curve of type DRAW_ARROW
Indicators Used:
Relative strength index
Custom Indicators Used:
Order Management characteristics:
Other Features: