//+------------------------------------------------------------------+
//|                                                    TD_REI_v2.mq4 |
//|                                                             Oleg |
//|                                                           nolink |
//+------------------------------------------------------------------+
#property copyright "Oleg"
#property link  "gendir@glagol.tvcom.ru"


#property indicator_separate_window
#property indicator_buffers 3
#property indicator_color1 OrangeRed
#property indicator_color2 Red
#property indicator_color3 Blue
double Reabs[21], Re[21], Sum, Sumabs, Rei, Tdrei, Arr[], Supply[], Demand[];
int length = 8, n=15;
double Supply_Line = 60;
double Demand_Line = -60;
//+------------------------------------------------------------------+
//| Custom indicator initialization function                         |
//+------------------------------------------------------------------+
int init()
  {
  SetIndexBuffer(0, Arr);
  SetIndexStyle (0, DRAW_LINE, STYLE_SOLID, 2);

    SetIndexBuffer(1, Supply);
  SetIndexStyle (1, DRAW_LINE, STYLE_SOLID, 1);

  SetIndexBuffer(2, Demand);
  SetIndexStyle (2, DRAW_LINE, STYLE_SOLID, 1);
//---- indicators
//----
   return(0);
  }
//+------------------------------------------------------------------+
//| Custor indicator deinitialization function                       |
//+------------------------------------------------------------------+
int deinit()
  {
//----

//----
   return(0);
  }
//+------------------------------------------------------------------+
//| Custom indicator iteration function                              |
//+------------------------------------------------------------------+
int start()
  {
   int shift, z;
   for (shift=n; shift>=0; shift--)
   {
      Re[0]=(High[shift]-High[shift+2])+(Low[shift]-Low[shift+2]);
      Reabs[0]=MathAbs(High[shift]-High[shift+2])+MathAbs(Low[shift]-Low[shift+2]);
      Sum = 0;
      Sumabs = 0;

      for (z = 0; z<=(length-1); z++)
      {
         Sum = Sum + Re[z];
         Sumabs = Sumabs + Reabs[z];
      }
      if (Sumabs>0) Rei = Sum/Sumabs;
      Tdrei = 100*Rei;
      if (Tdrei==0) Tdrei=0.00001;
      Arr[shift] = Tdrei;
      for (z=21;z>= 0;z--)
      {
      Re[z]=Re[z-1];
      Reabs[z]=Reabs[z-1];
      }
      Supply[shift] = Supply_Line;
      Demand[shift] = Demand_Line;
   }
//----

//----
   return(0);
  }
//+------------------------------------------------------------------+
Sample
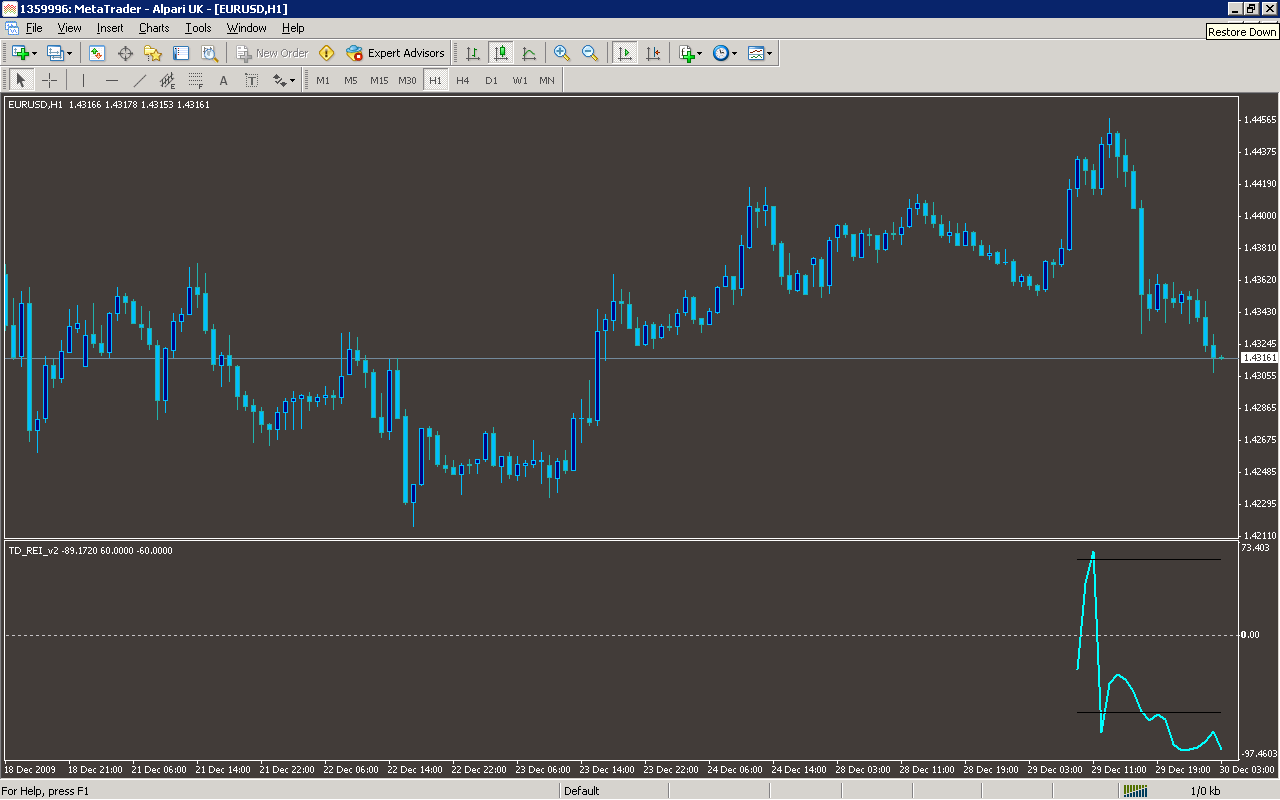
Analysis
Market Information Used:
Series array that contains the highest prices of each bar
Series array that contains the lowest prices of each bar
Indicator Curves created:
Indicators Used:
Custom Indicators Used:
Order Management characteristics:
Other Features: