//+------------------------------------------------------------------+
//|                                               EMAPredictive3.mq4 |
//|                                      Matthew ("Dr Chaos") Kennel |
//|                            ftp://lyapunov.ucsd.edu/pub/nonlinear |
//+------------------------------------------------------------------+
//
// Goal of this indicator:
//
//    Given three EMA's of varying lengths, use their values
//    for a estimator of "where we are now" or will be in the near future.
//    This is a very simplistic method, better ones are probably found
//    in the signal processing and target tracking literature.
//    A Kalman filter has been known since the 1950's 1960's and there
//    is better still.   Nevertheless this is easily programmable in the
//    typical environments of a retail trading application like Metatrader4.
//
// Method:
//
//     An an exponential moving average (EMA) or a simple moving average (SMA), for that
//     matter, have a bandwidth parameter 'L', the effective length of the window.  This
//     is in units of time or, really, inverse of frequency.  Higher L means a lower
//     frequency effect.
//
//     With a parameter L, the weighted time index of the EMA and SMA is (L-1)/2.  Example:
//     take an SMA of the previous 5 values:  -5 -4 -3 -2 -1 now.   The average "amount of time"
//     back in the past of the data which go in to the SMA is hence -3, or (L-1)/2.  Same applies
//     for an EMA.  The standard parameterization makes this correspondence between EMA
//     and SMA.
//
//     Therefore the idea here is to take two different EMA's, a longer, and
//     a shorter of lengths L1 and L2  (L2 <L1).     Now take the pairs:
//           [ -(L1-1)/2, EMA(L1) ]  [ -(L2-1)/2, EMA(L2) ]  which defines a line.
//
//
//     Extrapolate to [ExtraTimeForward, y], solve for y and that is the predictive EMA estimate.
//
// Application:
//     Traditional moving averages, as simple-minded linear filters, have significant group delay.
//     In engineering that isn't so important as nobody cares if your sound from your iPod is delayed
//     a few milliseconds after it is first processed.  But in markets, you can't
//     trade on the smoothed price, only the actual noisy, market price now.   Hence you
//     ought to estimate better.
//
//     This statistic (what math/science people call what technical analysts call an 'indicator')
//     may be useful as the "fast" moving average in a moving average crossover trading system.
//     It could also be useful for the slow moving average as well.
//
//     For instance, on a 5 minute chart:
//
//       try for the fast: (will be very wiggly, note)
//
//                           LongPeriod 25.0
//                           ShortPeriod 8.0
//                           ExtraTimeForward 1.0
//
//       and for the slow:
//
//                           LongPeriod 500.0
//                           ShortPeriod 50.0 to 200.0
//                           ExtraTimeForward 0.0
//
//  But often a regular MA for the slow can work as well or better, it appears from visual inspection.
//
//  Enjoy.
//
//  In chaos there is order, and in that order there is chaos and order inside again.
//
//  Then, surrounding everything, pointy haired bosses.
//
#property copyright "Matthew (Dr Chaos) Kennel"
#property link      "ftp://lyapunov.ucsd.edu/pub/nonlinear" // my academic software site.  No finance.

#property indicator_chart_window
#property indicator_buffers 1

#property indicator_color1 Red
//---- input parameters
extern double       LongPeriod=25.0;  // note that for an EMA you can have floating point numbers.
extern double       ShortPeriod=8.0;
extern double       ExtraTimeForward=1.0; // how much to further extrapolate location.

//---- buffers
//---- indicator buffers
double ExtBuffer[];

//+------------------------------------------------------------------+
//| Custom indicator initialization function                         |
//+------------------------------------------------------------------+
int init()
  {

   SetIndexBuffer(0,ExtBuffer);
 //---- drawing settings
   SetIndexStyle(0,DRAW_LINE);
//---- initialization done
   return(0);
  }


int start()
  {
   int limit;
   int counted_bars=IndicatorCounted();
   double ma1,ma3;
   double p1,p3;
   double t1,t3,t;

//---- check for possible errors
   if(counted_bars<0) return(-1);
//---- last counted bar will be recounted
   if(counted_bars>0) counted_bars--;
   limit=Bars-counted_bars;

//---- main loop
   p1 = 2.0/(LongPeriod+1.0);
   p3 = 2.0/(ShortPeriod+1.0);

   t1 = (LongPeriod-1.0)/2.0;
   t3 = (ShortPeriod-1.0)/2.0;
   t = ShortPeriod + ExtraTimeForward;

   ma1 = Close[limit-1];
   ma3 = ma1;
   for(int i=limit-1; i>= 0; i--) {
      //---- ma_shift set to 0 because SetIndexShift called abowe
      double val = Close[i];
      double slope1, predict;


      ma1 = p1*val + (1.0-p1)*ma1;
      ma3 = p3*val + (1.0-p3)*ma3;

      slope1 = (ma3-ma1)/(t1-t3);

      predict = ma3 + slope1*t;

      ExtBuffer[i]=predict;
  }
//---- done
   return(0);
}
//+------------------------------------------------------------------+
Sample
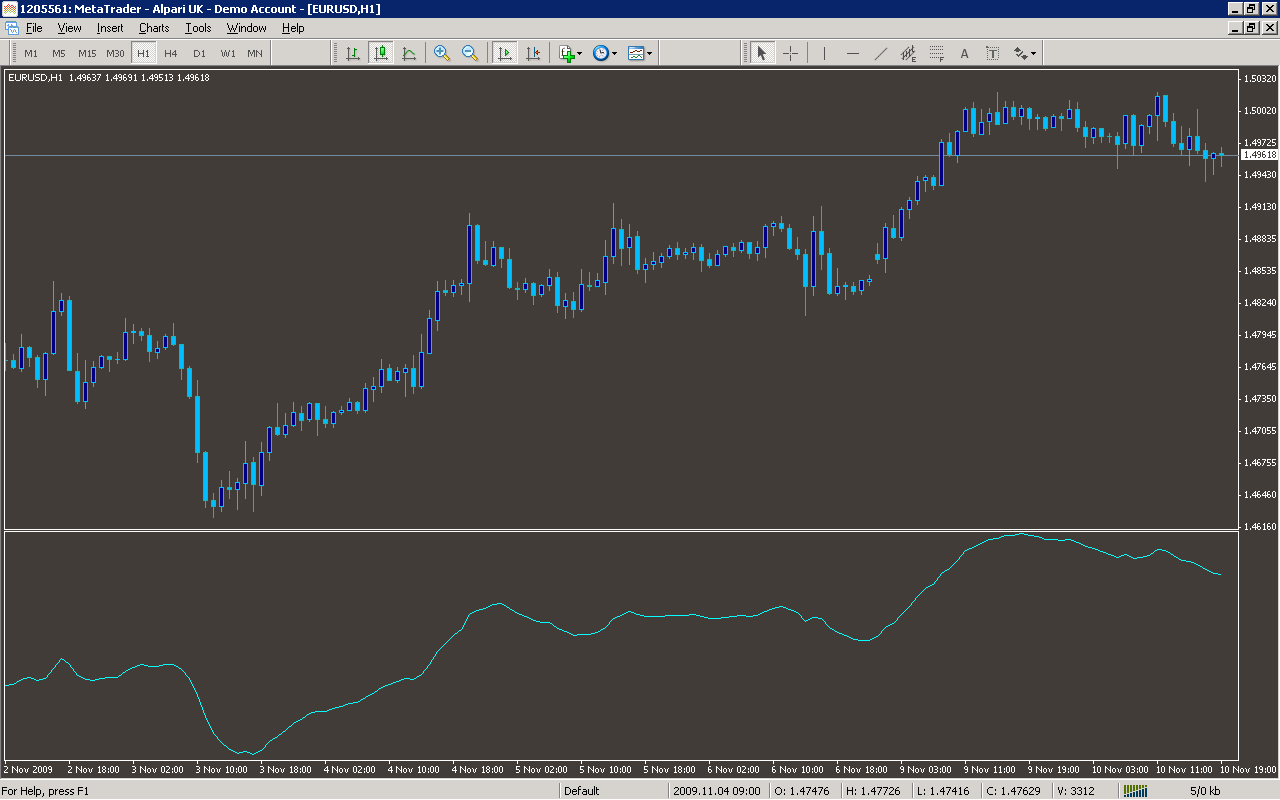
Analysis
Market Information Used:
Series array that contains close prices for each bar
Indicator Curves created:
Implements a curve of type DRAW_LINE
Indicators Used:
Custom Indicators Used:
Order Management characteristics:
Other Features: