//+------------------------------------------------------------------+
//|                                               Up Down Bar.mq4 |
//|                         Copyright © 2008, TradeForexFx |
//|                                 |
//+------------------------------------------------------------------+
#property copyright "Copyright © 2008, TradeForexFx"
#property link      "http://"

//#property indicator_separate_window

#property indicator_chart_window
#property indicator_buffers 2
#property indicator_color1 Blue
#property indicator_color2 Red

//---- input parameters
extern int       Percent = 33;

//---- buffers
double up[];
double dn[];

//+------------------------------------------------------------------+
//| Custom indicator initialization function                         |
//+------------------------------------------------------------------+
int init()
{
//---- indicators
   SetIndexStyle(0, DRAW_ARROW, EMPTY);
   SetIndexBuffer(0, up);
   SetIndexArrow(0, 233);

   SetIndexStyle(1, DRAW_ARROW, EMPTY);
   SetIndexBuffer(1, dn);
   SetIndexArrow(1, 234);


//----
   return(0);
}

//+------------------------------------------------------------------+
//| Custom indicator deinitialization function                       |
//+------------------------------------------------------------------+
int deinit()
{
//----

//----
   return(0);
}

//+------------------------------------------------------------------+
//| Custom indicator iteration function                              |
//+------------------------------------------------------------------+
//int start()
//{
 //  int    counted_bars = IndicatorCounted();
 //  double spread;
 //  double band;
 //  int limit = Bars - counted_bars;
 //  if(counted_bars == 0)
 //  {
 //     limit = Bars - 1;
 //  }


 int start() {

   int limit, i, counter;
   int counted_bars=IndicatorCounted();
   double spread;
   double band;
   double Range, AvgRange;


//---- check for possible errors
   if(counted_bars<0) return(-1);
//---- last counted bar will be recounted
   if(counted_bars>0) counted_bars--;

   limit=Bars-counted_bars;


//----
//   for(int i = 0; i < limit; i++)
//   {

     for(i = 0; i <= limit; i++) {

      counter=i;
      Range=0;
      AvgRange=0;
      for (counter=i ;counter<=i+9;counter++)
      {
         AvgRange=AvgRange+MathAbs(High[counter]-Low[counter]);
      }
      Range=AvgRange/10;


      spread = High[i] - Low[i];
      band = spread * Percent * 0.01;

      up[i] = 0;
      dn[i] = 0;

      if(Open[i] < Low[i] + band && Close[i] > High[i] - band)
      {
      //   dn[i] = Low[i];
         up[i] = Low[i] - Range*0.5;
      }
      else if(Close[i] < Low[i] + band && Open[i] > High[i] - band)
      {
    //     up[i] = Low[i];
         dn[i] = High[i] + Range*0.5;
      }
   }
//----
   return(0);
}
//+------------------------------------------------------------------+
Sample
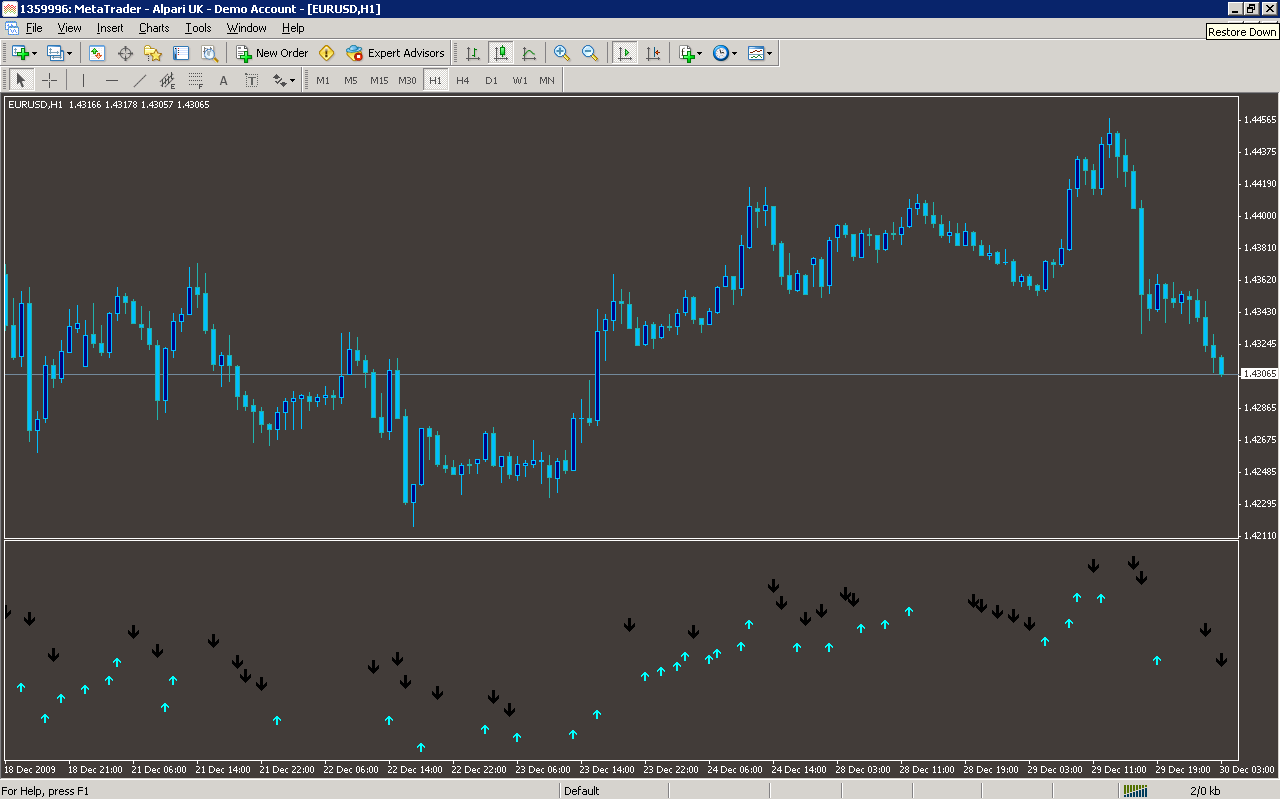
Analysis
Market Information Used:
Series array that contains the highest prices of each bar
Series array that contains the lowest prices of each bar
Series array that contains close prices for each bar
Series array that contains open prices of each bar
Indicator Curves created:
Implements a curve of type DRAW_ARROW
Indicators Used:
Custom Indicators Used:
Order Management characteristics:
Other Features: