//+------------------------------------------------------------------+
//|                                                               fAMA.mq4 |
//|                                             Copyright © 2005, Profi_R |
//+------------------------------------------------------------------+
#property copyright "Copyright © 2005, Profi_R"
#property link      "rvm_fam@fromru.com"

#property indicator_chart_window
#property indicator_buffers 1
#property indicator_color1 Black
//---- input parameters
extern int Range=10;
extern int FastMA=2;
extern int SlowMA=30;
extern int filter=50;
extern int n=4;
extern int h=10;
//---- buffers
double fAMA[];
double mAMA[];
//+------------------------------------------------------------------+
//| Custom indicator initialization function                               |
//+------------------------------------------------------------------+
int init()
  {
   string short_name; //????????? ?????????? short_name ???? "?????????"
//---- indicators
   IndicatorBuffers(2);
   SetIndexStyle(0,DRAW_LINE);
   SetIndexBuffer(0,fAMA);
   SetIndexBuffer(1,mAMA);
//---- name for DataWindow and indicator subwindow label
   //?????????? short_name ??????????? ????????? ???????? ?????? ?????????
   short_name="fAMA("+Range+","+FastMA+","+SlowMA+","+filter+","+n+","+h+")";
   //??? ??????????? ?? ??????? ???????? ?????????? ??????? ????????????
   IndicatorShortName(short_name);
   SetIndexLabel(0,short_name);//????????? ????? ??? ??????
//----
   SetIndexDrawBegin(0,Range); //????????? ????????? ????? ?????????? ??? 0 ??????
//----
   return(0);
  }
//+------------------------------------------------------------------+
//| Custom indicator iteration function                                    |
//+------------------------------------------------------------------+
int start()
  {
   int    counted_bars=IndicatorCounted();
//---- TODO: add your code here
   int cb,i;
   double  k1,k2,Noise,ER,SSC,AMA,sdAMA,dAMA;
   if(Bars<=Range) return(0);
   else
   {
      k1=2.0/(SlowMA+1);
      k2=2.0/(FastMA+1)-k1;
      AMA=Close[Bars-Range];
      mAMA[Bars-Range]=Close[Bars-Range+1];
      for(cb=Bars-counted_bars-Range-1;cb>=0;cb--)
      {
         Noise=0;
         for(i=cb;i<=cb+Range-1;i++)
         {
            Noise=Noise+MathAbs(Close[i]-Close[i+1]);
         }
         if(Noise!=0)
         {
            ER=MathAbs(Close[cb]-Close[cb+Range])/Noise;
         }
         else
         {
            ER=0;
         }
         SSC=(ER*k2+k1);
         AMA=AMA+NormalizeDouble(SSC*SSC*(Close[cb]-AMA),4);
         mAMA[cb]=AMA;
         if(filter<1)
         {
            fAMA[cb]=mAMA[cb];
         }
         else
         {
            for(i=cb;i<=cb+SlowMA-1;i++)
            {
               sdAMA=sdAMA+MathAbs(mAMA[i]-mAMA[i+1]);
            }
            dAMA=mAMA[cb]-mAMA[cb+1];
            if(dAMA>=0)
            {
               if(dAMA<NormalizeDouble(filter*sdAMA/(100*SlowMA),4)&&
                  High[cb]<=High[Highest(NULL,0,MODE_HIGH,n,cb)]+h*Point)
               {
                  fAMA[cb]=fAMA[cb+1];
               }
               else
               {
                  fAMA[cb]=mAMA[cb];
               }
            }
            else
            {
               if(MathAbs(dAMA)<NormalizeDouble(filter*sdAMA/(100*SlowMA),4)&&
                  Low[Lowest(NULL,0,MODE_LOW,n,cb)]-h*Point<Low[cb])
               {
                  fAMA[cb]=fAMA[cb+1];
               }
               else
               {
                  fAMA[cb]=mAMA[cb];
               }
            }
            sdAMA=0.0;
         }
      }
   }
//----
   return(0);
  }
//+------------------------------------------------------------------+
Sample
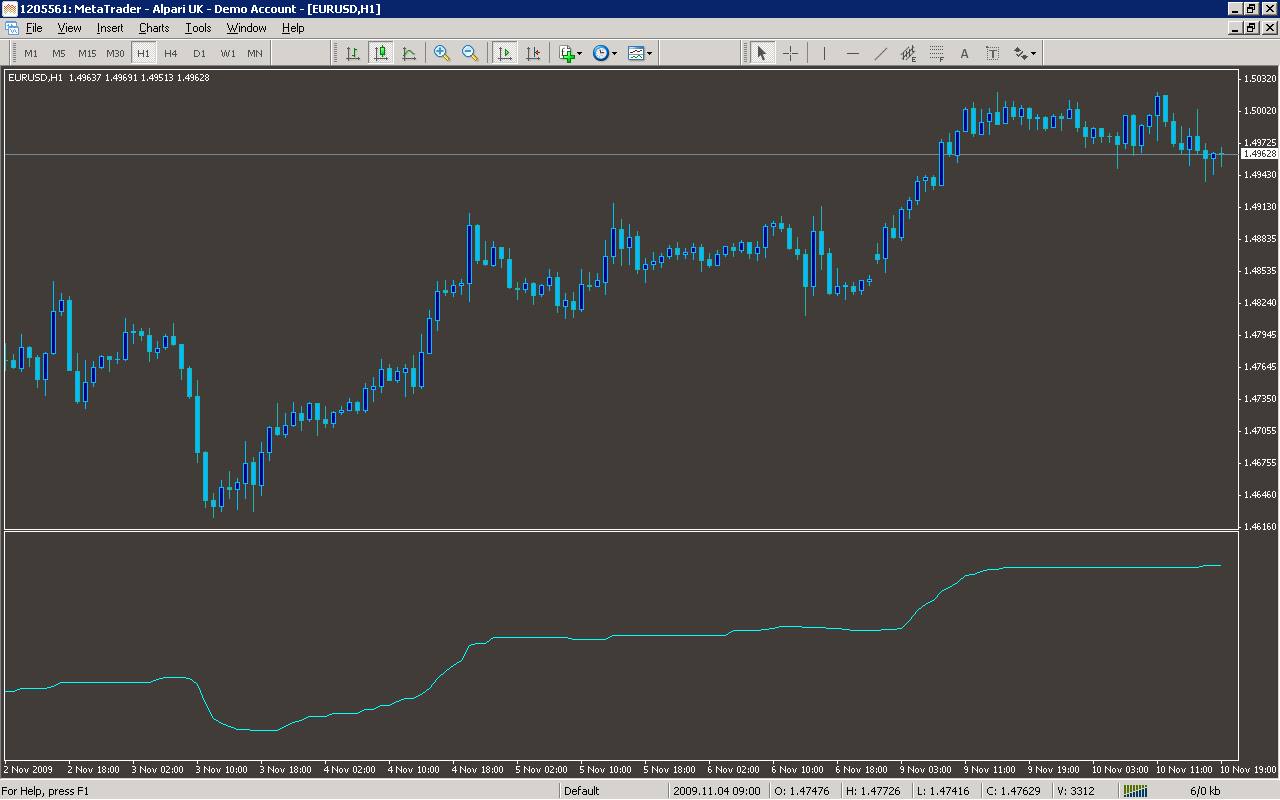
Analysis
Market Information Used:
Series array that contains close prices for each bar
Series array that contains the highest prices of each bar
Series array that contains the lowest prices of each bar
Indicator Curves created:
Implements a curve of type DRAW_LINE
Indicators Used:
Custom Indicators Used:
Order Management characteristics:
Other Features: