//+------------------------------------------------------------------+
//|                                                                  |
//|                      Copyright © 2004, MetaQuotes Software Corp. |
//|                                       http://www.metaquotes.net/ |
//+------------------------------------------------------------------+
//
// Description:  Fractal Adaptive Moving Average - by John Ehlers
// Version 1.0  8/9/2005
// Notes:
// October 2005 Issue - "FRAMA - Fractal Adaptive Moving Average"
//  Length will be forced to be an even number. Odd numbers will be bumped up to the
//  next even number.
// Formula Parameters:     Defaults:
// RPeriod                              16

#property  copyright "Copyright © 2005, MrPip "
#property  link      "http://www.metaquotes.net/"

//---- indicator settings
#property  indicator_chart_window
#property  indicator_buffers 1
#property indicator_color1 Red

//---- buffers
double ExtMapBuffer1[];


extern int RPeriod = 60;
int shift;
int loopbegin;
double Filt_1 = 0;   //previous bar's Filt

//+------------------------------------------------------------------+
//| Custom indicator initialization function                         |
//+------------------------------------------------------------------+
int init()
  {


//---- 1 additional buffers are used for counting.
   IndicatorBuffers(1);

//---- drawing settings
   SetIndexBuffer(0,ExtMapBuffer1);
   SetIndexStyle(0,DRAW_LINE,STYLE_SOLID,2);
   SetIndexShift(0,0);
   IndicatorDigits(MarketInfo(Symbol(),MODE_DIGITS));

//---- initialization done
   return(0);
  }

int start()

  {
     if (Bars < RPeriod) return(0);
     Comment("Bars : ",Bars);
     loopbegin = Bars - RPeriod - 1;
     Filt_1=Close[loopbegin];


      for(shift = loopbegin; shift >= 0; shift--)
      {

        Filt_1 = FAMA();
//        if (shift < RPeriod+1) Filt = Close[shift];


//========== COLOR CODING ===========================================

       ExtMapBuffer1[shift] = Filt_1;

      }


  // done

     return (0);
   }

   double FAMA()
   {
   double Filt = 0;

   int count = 0;
   int tmp = 0;
   int N = 0;
   int HalfN = 0;
   double N1 = 0;
   double N2 = 0;
   double N3 = 0;
   double HH = 0;
   double LL = 0;
   double Dimen = 0;
   double alpha = 0;


    N = MathFloor(RPeriod/2)*2;  // Force N to even number
    HalfN = MathFloor(N/2);

     N3 = (High[Highest(NULL,0,MODE_HIGH,shift + N-1, shift)] - Low[Lowest(NULL,0,MODE_LOW,shift + N-1, shift)]) / N;
 //   Print("High ",High[Highest(NULL,0,MODE_HIGH,shift+N, shift)],"Low ",Low[Lowest(NULL,0,MODE_LOW,shift+N, shift)]);
    HH = High[shift+N-1];
    LL = Low[shift+N-1];

    // First half

    for( count = 0; count <= (HalfN -1); count++) {
        tmp = shift + count;
        if (High[tmp] > HH) HH = High[tmp];
        if (Low[tmp] < LL) LL = Low[tmp];
    }
    N1 = (HH - LL) / HalfN;
    HH = High[shift+HalfN-1];
    LL = Low[shift+HalfN-1];

 // Second half

    for (count = HalfN; count <= (N-1); count++) {
        tmp = shift + count;
        if (High[tmp] > HH) HH = High[tmp];
        if (Low[tmp] < LL) LL = Low[tmp];
    }
    N2 = (HH - LL) / HalfN;

    if (N1 > 0 && N2 > 0 && N3 > 0) {
        Dimen = (MathLog(N1 + N2) - MathLog(N3)) / MathLog(2);
    }

    alpha = MathExp(-4.6*(Dimen - 1));

    if (alpha < 0.01) alpha = 0.01;
    if (alpha > 1) alpha = 1;

    Filt = (alpha*Close[shift]) + (1 - alpha)*Filt_1;


    return (Filt);

}
//+------------------------------------------------------------------+
Sample
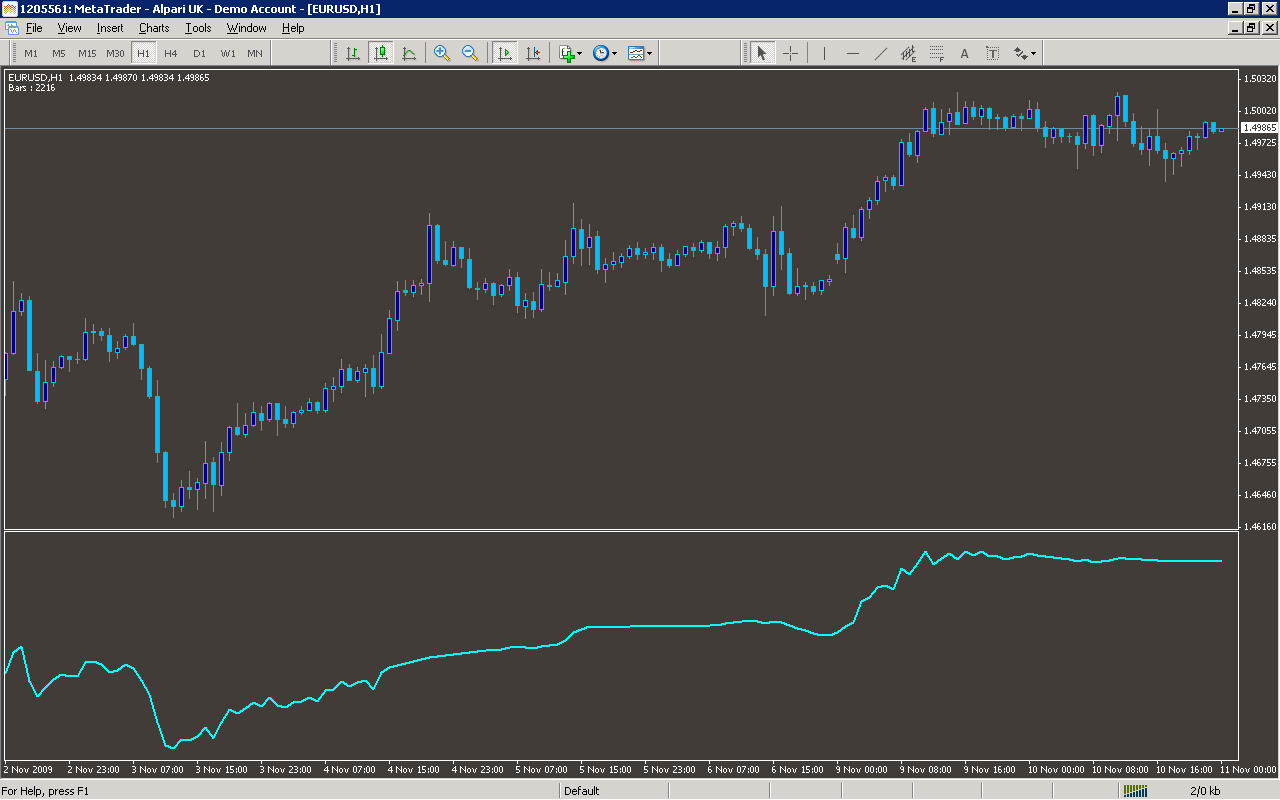
Analysis
Market Information Used:
Series array that contains close prices for each bar
Series array that contains the highest prices of each bar
Series array that contains the lowest prices of each bar
Indicator Curves created:
Implements a curve of type DRAW_LINE
Indicators Used:
Custom Indicators Used:
Order Management characteristics:
Other Features: