//+------------------------------------------------------------------+
//|                                                    Fisher_v1.mq4 |
//|                           Copyright © 2005, TrendLaboratory Ltd. |
//|            http://finance.groups.yahoo.com/group/TrendLaboratory |
//|                                       E-mail: igorad2004@list.ru |
//+------------------------------------------------------------------+
#property copyright "Copyright © 2005, TrendLaboratory Ltd."
#property link      "http://finance.groups.yahoo.com/group/TrendLaboratory"

#property indicator_separate_window
#property indicator_buffers 2
#property indicator_color1 LightBlue
#property indicator_color2 Tomato
//---- input parameters
extern int Length=10;
extern int Price=4;
extern int NumBars=0;
//---- buffers
double UpBuffer [];
double DnBuffer [];
double Value [];
double Fisher[];

int init()
  {
  IndicatorBuffers(4);

  SetIndexStyle(0,DRAW_HISTOGRAM,STYLE_SOLID,2);
  SetIndexStyle(1,DRAW_HISTOGRAM,STYLE_SOLID,2);

  SetIndexBuffer(0,UpBuffer);
  SetIndexBuffer(1,DnBuffer);
  SetIndexBuffer(2,Value);
  SetIndexBuffer(3,Fisher);

  IndicatorShortName ("Fisher(" + Length + "," + Price + ")");
  SetIndexLabel (0, "UpTrend");
  SetIndexLabel (1, "DownTrend");

  SetIndexDrawBegin(0,Length);
  SetIndexDrawBegin(1,Length);

  return(0);
  }


//+------------------------------------------------------------------+
//| Fisher_v1                                                         |
//+------------------------------------------------------------------+
int start()
  {
  int shift;

  double smin=0,smax=0;

if (NumBars>0) int NBars=NumBars; else NBars=Bars;

for(shift=NBars;shift>=0;shift--)
   {
   UpBuffer[shift]=0.0;
   DnBuffer[shift]=0.0;
   Value [shift]=0.0;
   Fisher[shift]=0.0;
   }

for(shift=NBars-1-Length;shift>=0;shift--)
   {
   smax = High[Highest(NULL,0,MODE_HIGH,Length,shift)];
   smin = Low[Lowest(NULL,0,MODE_LOW,Length,shift)];

   double price = iMA(NULL,0,1,0,0,Price,shift);
   if (smax-smin==0.0) double wpr=1.0; else wpr=(price-smin)/(smax-smin);
   Value[shift] = 0.33*2*(wpr-0.5) + 0.67*Value[shift+1];
   Value[shift] = MathMin(MathMax(Value[shift],-0.999),0.999);
   Fisher[shift] = 0.5*MathLog((1.0+Value[shift])/(1.0-Value[shift]))+0.5*Fisher[shift+1];

   if (Fisher[shift]>=0)
     {
     UpBuffer[shift] = Fisher[shift];
     DnBuffer[shift] = 0.0;
     }
   else
     {
     UpBuffer[shift] = 0.0;
     DnBuffer[shift] = Fisher[shift];
     }
   }
  return(0);
  }
//+------------------------------------------------------------------+
Sample
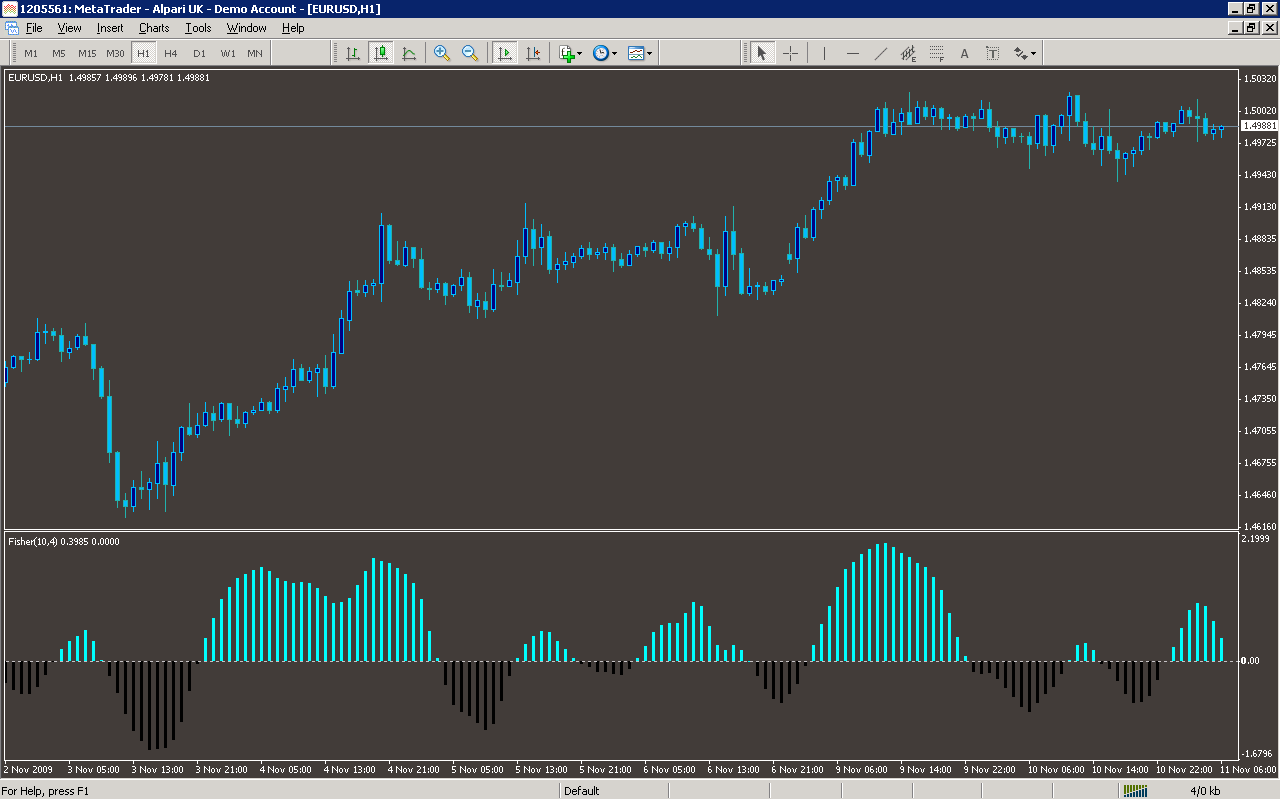
Analysis
Market Information Used:
Series array that contains the highest prices of each bar
Series array that contains the lowest prices of each bar
Indicator Curves created:
Implements a curve of type DRAW_HISTOGRAM
Indicators Used:
Moving average indicator
Custom Indicators Used:
Order Management characteristics:
Other Features: