//+------------------------------------------------------------------+
//|                                                  FlatTrendV3.mq4 |
//|                                                       Kirk Sloan |
//|                                        http://www.metaquotes.net |
//+------------------------------------------------------------------+
#property copyright "Kirk Sloan"
#property link      "ksfx@kc.rr.com"

#property indicator_separate_window
#property indicator_minimum 0
#property indicator_maximum 1
#property indicator_buffers 4
#property indicator_color1 Red
#property indicator_color2 LimeGreen
#property indicator_color3 Salmon
#property indicator_color4 LightGreen //added
#property indicator_color5 Orange //added
#property indicator_width1 2 //added
#property indicator_width2 2 //added
#property indicator_width3 1 //added
#property indicator_width4 1 //added
#property indicator_width5 1 //added
//---- input parameters
extern int Minutes=5;
extern int period=30;
extern int price=6; // 0 or other = (H+L)/2
                    // 1 = Open
                    // 2 = Close
                    // 3 = High
                    // 4 = Low
                    // 5 = (H+L+C)/3
                    // 6 = (O+C+H+L)/4
                    // 7 = (O+C)/2

//---- buffers
double ExtMapBuffer1[];
double ExtMapBuffer2[];
double ExtMapBuffer3[];
double ExtMapBuffer4[];
double ExtMapBuffer5[];
double Ma;
double hhigh, llow;
double PADX,NADX;
string TimeFrameStr;
double _price;
double MinL=0;
double MaxH=0;

double Value=0,Value1=0,Value2=0,Fish=0,Fish1=0,Fish2=0;
//+------------------------------------------------------------------+
//| Custom indicator initialization function                         |
//+------------------------------------------------------------------+
int init()
  {
//---- indicators
  IndicatorBuffers(5);
  SetIndexStyle(0,DRAW_HISTOGRAM,STYLE_SOLID,2); //modified
  SetIndexBuffer(0,ExtMapBuffer1);
  SetIndexStyle(1,DRAW_HISTOGRAM,STYLE_SOLID,2); //modified
  SetIndexBuffer(1,ExtMapBuffer2);
  SetIndexStyle(2,DRAW_HISTOGRAM,STYLE_SOLID,1); //modified
  SetIndexBuffer(2,ExtMapBuffer3);
  SetIndexStyle(3,DRAW_HISTOGRAM,STYLE_SOLID,1); //modified
  SetIndexBuffer(3,ExtMapBuffer4);
  SetIndexLabel(0,NULL); //added
  SetIndexLabel(1,NULL); //added
  SetIndexLabel(2,NULL); //added
  SetIndexLabel(3,NULL); //added
  SetIndexLabel(4,NULL); //added

switch(Minutes)
   {
      case 1 : TimeFrameStr="Period_M1"; break;
      case 5 : TimeFrameStr="Period_M5"; break;
      case 15 : TimeFrameStr="Period_M15"; break;
      case 30 : TimeFrameStr="Period_M30"; break;
      case 60 : TimeFrameStr="Period_H1"; break;
      case 240 : TimeFrameStr="Period_H4"; break;
      case 1440 : TimeFrameStr="Period_D1"; break;
      case 10080 : TimeFrameStr="Period_W1"; break;
      case 43200 : TimeFrameStr="Period_MN1"; break;
      default : TimeFrameStr="Current Timeframe"; Minutes=0;
   }
   IndicatorShortName("Flat Trend V3("+TimeFrameStr+")");  //modified

//----
   return(0);
  }
//+------------------------------------------------------------------+
//| Custom indicator deinitialization function                       |
//+------------------------------------------------------------------+
int deinit()
  {
//----

//----
   return(0);
  }
//+------------------------------------------------------------------+
//| Custom indicator iteration function                              |
//+------------------------------------------------------------------+
int start()
  {
   int    counted_bars=IndicatorCounted();
//----

for (int i = 800; i > -1; i--){
   ExtMapBuffer1[i]=0;
   ExtMapBuffer2[i]=0;
   ExtMapBuffer3[i]=0;
   ExtMapBuffer4[i]=0;
   ExtMapBuffer5[i]=0;

   PADX=iADX(NULL,Minutes,14 ,PRICE_CLOSE,1,i);
   NADX=iADX(NULL,Minutes,14 ,PRICE_CLOSE,2,i);

  // MaxH = High[Highest(NULL,Minutes,MODE_HIGH,period,i)];
  // MinL = Low[Lowest(NULL,Minutes,MODE_LOW,period,i)];

   MaxH = iHigh(NULL, Minutes,Highest(NULL,Minutes,MODE_HIGH,period,i));
   MinL = iLow(NULL, Minutes,Lowest(NULL,Minutes,MODE_LOW,period,i));


   _price = (iHigh(NULL,Minutes,i)+iLow(NULL,Minutes,i))/2;

    if(price == 1) _price = iOpen(NULL,Minutes,i);
    if(price == 2) _price = iClose(NULL,Minutes,i);
    if(price == 3) _price = iHigh(NULL,Minutes,i);
    if(price == 4) _price = iLow(NULL,Minutes,i);
    if(price == 5) _price = (iHigh(NULL,Minutes,i)+iLow(NULL,Minutes,i)+iClose(NULL,Minutes,i))/3;
    if(price == 6) _price = (iOpen(NULL,Minutes,i)+iHigh(NULL,Minutes,i)+iLow(NULL,Minutes,i)+iClose(NULL,Minutes,i))/4;
    if(price == 7) _price = (iOpen(NULL,Minutes,i)+iClose(NULL,Minutes,i))/2;

   Value = 0.33*2*((_price-MinL)/(MaxH-MinL)-0.5) + 0.67*Value1;
   Value=MathMin(MathMax(Value,-0.999),0.999);
   Fish = 0.5*MathLog((1+Value)/(1-Value)) -0.5*Fish1 -0.5*Fish2;

   if (Fish > 0 && PADX > NADX){
      ExtMapBuffer2[i] = 1;
      }

   if (Fish > 0 && NADX > PADX){
      ExtMapBuffer4[i] = 1;
      }

   if (Fish < 0 && NADX > PADX){
      ExtMapBuffer1[i] = 1;
         }

   if (Fish < 0 && PADX > NADX){
      ExtMapBuffer3[i] = 1;
         }

   if (ExtMapBuffer1[i] == 0 && ExtMapBuffer2[i] == 0){
      //ExtMapBuffer3[i] = 1;
      }

   if (Fish == 0 && PADX > NADX){
      ExtMapBuffer2[i] = 1;
      }
   if (Fish == 0 && PADX < NADX){
      ExtMapBuffer1[i] = 1;
      }

   Value1 = Value;
   Fish2 = Fish1;
   Fish1 = Fish;
}

//----
   return(0);
  }
//+------------------------------------------------------------------+
Sample
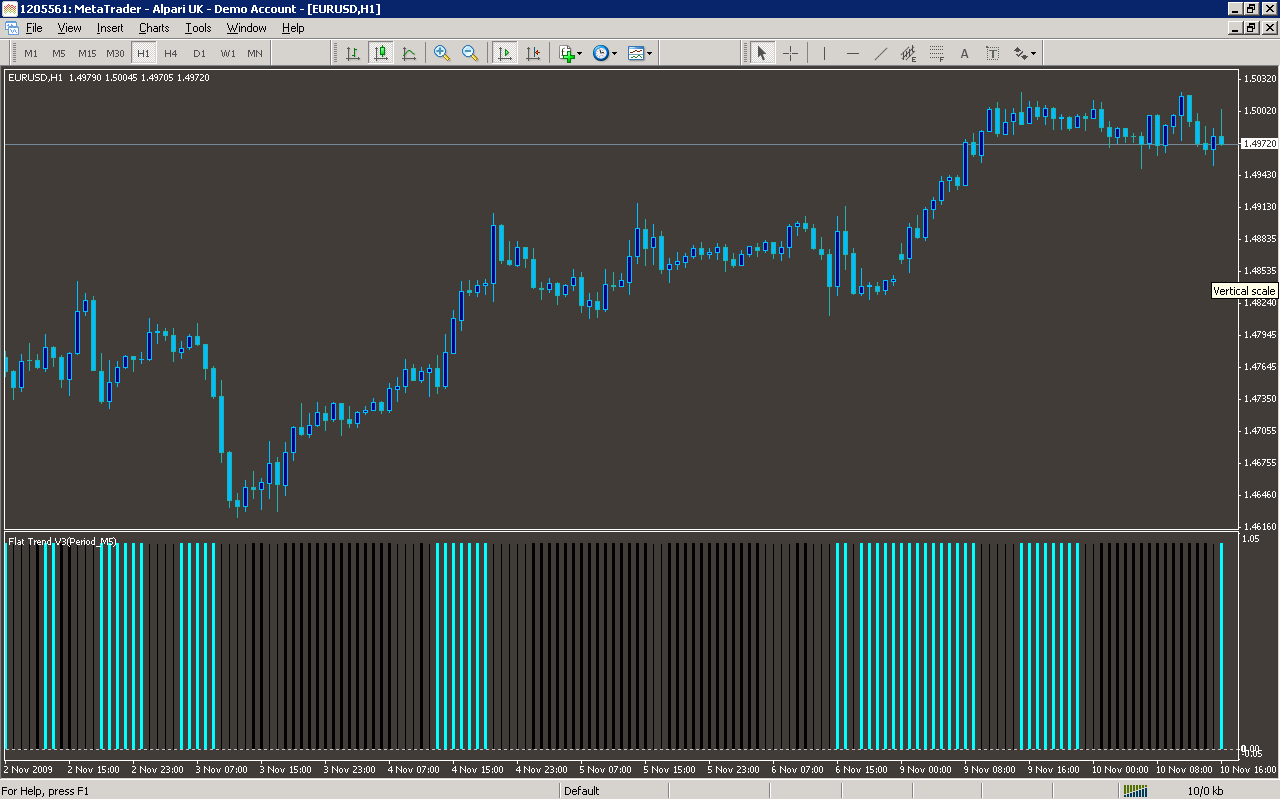
Analysis
Market Information Used:
Series array that contains the highest prices of each bar
Series array that contains the lowest prices of each bar
Series array that contains open prices of each bar
Series array that contains close prices for each bar
Indicator Curves created:
Implements a curve of type DRAW_HISTOGRAM
Indicators Used:
Movement directional index
Custom Indicators Used:
Order Management characteristics:
Other Features: