//+------------------------------------------------------------------+
//|                                                           FP.mq4 |
//|                                 Copyright © 2006, Nick A. Zhilin |
//|                                              rebus@dialup.etr.ru |
//+------------------------------------------------------------------+
#property copyright "Copyright © 2006, Nick A. Zhilin"
#property link      "rebus@dialup.etr.ru"
//----
extern int IPeriod = 100;
//----
#property indicator_chart_window
#property indicator_buffers 3
#property indicator_color1 Yellow
#property indicator_color2 Red
#property indicator_color3 Aqua
//---- buffers
double ExtMapBuffer1[];
double ExtMapBuffer2[];
double ExtMapBuffer3[];
//+------------------------------------------------------------------+
//| Custom indicator initialization function                         |
//+------------------------------------------------------------------+
int init()
  {
   IndicatorShortName("Float Pivot");
//---- indicators
   SetIndexStyle(0, DRAW_LINE);
   SetIndexBuffer(0, ExtMapBuffer1);
   SetIndexLabel(0, "Pivot");
   SetIndexStyle(1, DRAW_LINE);
   SetIndexBuffer(1, ExtMapBuffer2);
   SetIndexLabel(1, "HL1");
   SetIndexStyle(2, DRAW_LINE);
   SetIndexBuffer(2, ExtMapBuffer3);
   SetIndexLabel(2, "HL2");
//----
   Comment("FloatPivot(" + IPeriod + ")");
//----
   return(0);
  }
int deinit()
  {
   Comment("");
//----
   return(0);
  }
//+------------------------------------------------------------------+
//| Float Pivot                                                      |
//+------------------------------------------------------------------+
int start()
  {
   int i, counted_bars = IndicatorCounted();
//----
   i = Bars - counted_bars - 1;
   while(i >= 0)
     {
       double max = High[Highest(NULL, 0, MODE_HIGH, IPeriod, i)];
       double min = Low[Lowest(NULL, 0, MODE_LOW, IPeriod, i)];
       double pivot = (Close[i+1] + Close[i+2] + Close[i+3]) / 3;
       // Pivot
       ExtMapBuffer1[i] = (max + min + pivot) / 3;
       // (R1 - Pivot) / 2
       ExtMapBuffer2[i] = ((2*(max + min + pivot) / 3 - min) +
                           (max+min+pivot) / 3) / 2;
       // (Pivot - S1) / 2
       ExtMapBuffer3[i] = ((max + min + pivot) / 3 +
                           (2*(max + min + pivot) / 3 - max)) / 2;
       i--;
     }
//----
   return(0);
  }
//+------------------------------------------------------------------+
Sample
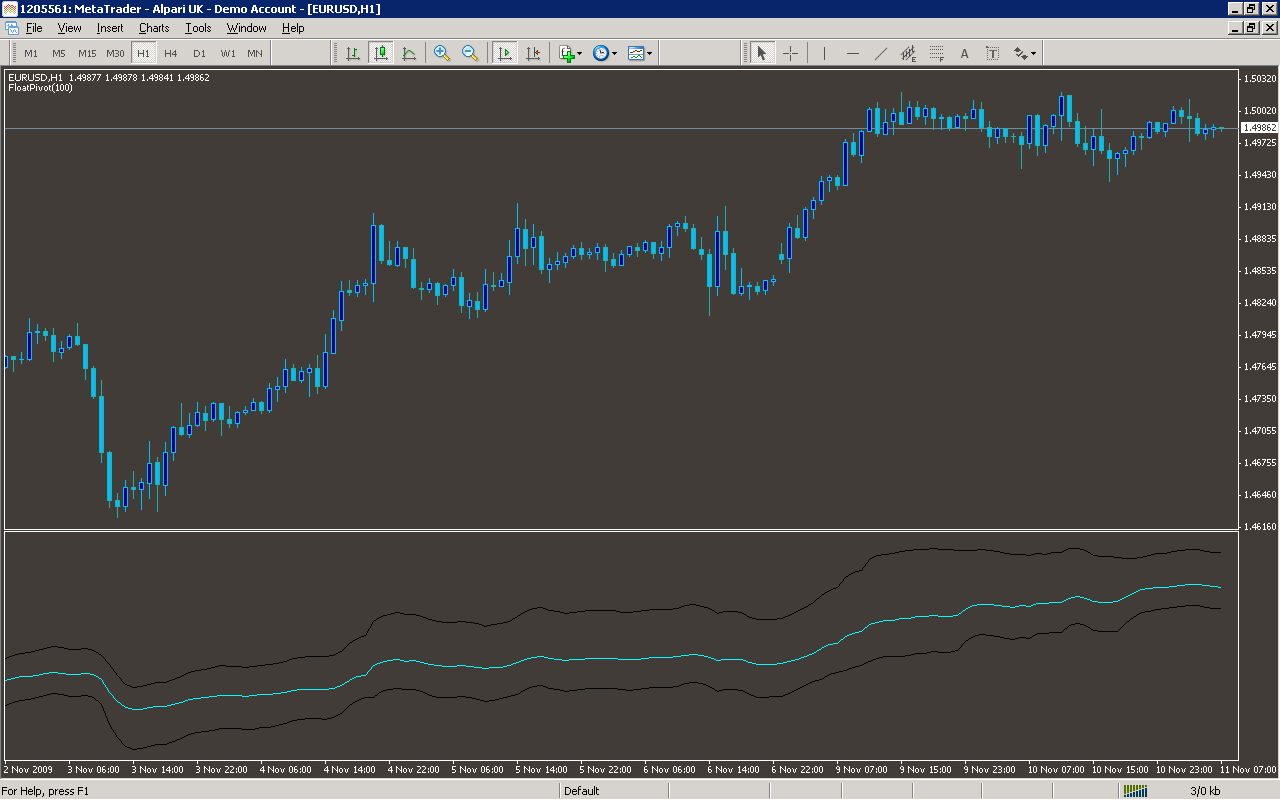
Analysis
Market Information Used:
Series array that contains the highest prices of each bar
Series array that contains the lowest prices of each bar
Series array that contains close prices for each bar
Indicator Curves created:
Implements a curve of type DRAW_LINE
Indicators Used:
Custom Indicators Used:
Order Management characteristics:
Other Features: