//+------------------------------------------------------------------+
//|                                              StepMA_Stoch_v1.mq4 |
//|                           Copyright © 2005, TrendLaboratory Ltd. |
//|                                       E-mail: igorad2004@list.ru |
//|           I just added alert - Kalenzo (http://www.fxservice.eu) |
//+------------------------------------------------------------------+
#property copyright "Copyright © 2005, TrendLaboratory Ltd."
#property link      "E-mail: igorad2004@list.ru"

#property indicator_separate_window
#property indicator_buffers 2
#property indicator_color1 LightGreen
#property indicator_color2 Gold
#property indicator_minimum -25
#property indicator_maximum 25

//---- input parameters
extern int PeriodWATR=10;
extern double Kwatr=1.0000;
extern int HighLow=0;

//---- indicator buffers
double LineMinBuffer[];
double LineMidBuffer[];
double stepSignalBuffer[];
double momBuffer[];
extern double alertLevel = 10;
int ab = 0;
double psb = 0;
//+------------------------------------------------------------------+
//| Custom indicator initialization function                         |
//+------------------------------------------------------------------+
  int init() {
   string short_name;
//---- indicator line
   //SetIndexStyle(0,DRAW_LINE,STYLE_SOLID, 1);
   //SetIndexStyle(1,DRAW_LINE,STYLE_SOLID, 1);
   SetIndexStyle(1,DRAW_HISTOGRAM, STYLE_SOLID, 1);
   SetIndexStyle(2,DRAW_LINE,STYLE_SOLID, 1);
   //SetIndexBuffer(0, LineMinBuffer);
   //SetIndexBuffer(1, LineMidBuffer);
   SetIndexBuffer(1, stepSignalBuffer);
   SetIndexBuffer(2, momBuffer);

   IndicatorDigits(MarketInfo(Symbol(),MODE_DIGITS));
//---- name for DataWindow and indicator subwindow label
   short_name="FLOW ("+PeriodWATR+","+Kwatr+","+HighLow+")";
   IndicatorShortName(short_name);
   //SetIndexLabel(0,"StepMA Stoch 1");
   //SetIndexLabel(1,"StepMA Stoch 2");
   SetIndexLabel(1,"StepMA Hist");
   SetIndexLabel(2,"StepMA Mom");
//----
   //SetIndexDrawBegin(0,PeriodWATR);
   //SetIndexDrawBegin(1,PeriodWATR);
   SetIndexDrawBegin(1,PeriodWATR);
   SetIndexDrawBegin(2,PeriodWATR);
//----
   return(0);
  }

//+------------------------------------------------------------------+
//| StepMA_3D_v1                                                         |
//+------------------------------------------------------------------+
int start() {
   int      i,shift,TrendMin,TrendMax,TrendMid;
   double   SminMin0,SmaxMin0,SminMin1,SmaxMin1,SumRange,dK,WATR0,WATRmax,WATRmin,WATRmid;
   double   SminMax0,SmaxMax0,SminMax1,SmaxMax1,SminMid0,SmaxMid0,SminMid1,SmaxMid1;
   double   linemin,linemax,linemid,Stoch1,Stoch2,bsmin,bsmax;

   for(shift=Bars-1;shift>=0;shift--)
   {
	SumRange=0;
	for (i=PeriodWATR-1;i>=0;i--)
	    {
       dK = 1+1.0*(PeriodWATR-i)/PeriodWATR;
       SumRange+= dK*MathAbs(High[i+shift]-Low[i+shift]);
       }
	WATR0 = SumRange/PeriodWATR;

	WATRmax=MathMax(WATR0,WATRmax);
	if (shift==Bars-1-PeriodWATR) WATRmin=WATR0;
	WATRmin=MathMin(WATR0,WATRmin);

	int StepSizeMin=MathRound(Kwatr*WATRmin/Point);
	int StepSizeMax=MathRound(Kwatr*WATRmax/Point);
	int StepSizeMid=MathRound(Kwatr*0.5*(WATRmax+WATRmin)/Point);

	if (HighLow>0) {
	  SmaxMin0=Low[shift]+2*StepSizeMin*Point;
	  SminMin0=High[shift]-2*StepSizeMin*Point;

	  SmaxMax0=Low[shift]+2*StepSizeMax*Point;
	  SminMax0=High[shift]-2*StepSizeMax*Point;

	  SmaxMid0=Low[shift]+2*StepSizeMid*Point;
	  SminMid0=High[shift]-2*StepSizeMid*Point;

	  if(Close[shift]>SmaxMin1) TrendMin=1;
	  if(Close[shift]<SminMin1) TrendMin=-1;

	  if(Close[shift]>SmaxMax1) TrendMax=1;
	  if(Close[shift]<SminMax1) TrendMax=-1;

	  if(Close[shift]>SmaxMid1) TrendMid=1;
	  if(Close[shift]<SminMid1) TrendMid=-1;
	}

	if (HighLow == 0) {
	  SmaxMin0=Close[shift]+2*StepSizeMin*Point;
	  SminMin0=Close[shift]-2*StepSizeMin*Point;

	  SmaxMax0=Close[shift]+2*StepSizeMax*Point;
	  SminMax0=Close[shift]-2*StepSizeMax*Point;

	  SmaxMid0=Close[shift]+2*StepSizeMid*Point;
	  SminMid0=Close[shift]-2*StepSizeMid*Point;

	  if(Close[shift]>SmaxMin1) TrendMin=1;
	  if(Close[shift]<SminMin1) TrendMin=-1;

	  if(Close[shift]>SmaxMax1) TrendMax=1;
	  if(Close[shift]<SminMax1) TrendMax=-1;

	  if(Close[shift]>SmaxMid1) TrendMid=1;
	  if(Close[shift]<SminMid1) TrendMid=-1;
	  }

	  if(TrendMin>0 && SminMin0<SminMin1) SminMin0=SminMin1;
	  if(TrendMin<0 && SmaxMin0>SmaxMin1) SmaxMin0=SmaxMin1;

	  if(TrendMax>0 && SminMax0<SminMax1) SminMax0=SminMax1;
	  if(TrendMax<0 && SmaxMax0>SmaxMax1) SmaxMax0=SmaxMax1;

	  if(TrendMid>0 && SminMid0<SminMid1) SminMid0=SminMid1;
	  if(TrendMid<0 && SmaxMid0>SmaxMid1) SmaxMid0=SmaxMid1;


	  if (TrendMin>0) linemin=SminMin0+StepSizeMin*Point;
	  if (TrendMin<0) linemin=SmaxMin0-StepSizeMin*Point;

	  if (TrendMax>0) linemax=SminMax0+StepSizeMax*Point;
	  if (TrendMax<0) linemax=SmaxMax0-StepSizeMax*Point;

	  if (TrendMid>0) linemid=SminMid0+StepSizeMid*Point;
	  if (TrendMid<0) linemid=SmaxMid0-StepSizeMid*Point;

	  bsmin=linemax-StepSizeMax*Point;
	  bsmax=linemax+StepSizeMax*Point;
	  Stoch1=(linemin-bsmin)/(bsmax-bsmin);
	  Stoch2=(linemid-bsmin)/(bsmax-bsmin);

	  LineMinBuffer[shift]=Stoch1;
	  LineMidBuffer[shift]=Stoch2;
	  stepSignalBuffer[shift]=(Stoch1-Stoch2)*100;
	  momBuffer[shift]= iMomentumOnArray(stepSignalBuffer, ArraySize(stepSignalBuffer), 13, 0);


	  SminMin1=SminMin0;
	  SmaxMin1=SmaxMin0;

	  SminMax1=SminMax0;
	  SmaxMax1=SmaxMax0;

	  SminMid1=SminMid0;
	  SmaxMid1=SmaxMid0;
	}

	if(Bars>ab && psb!=0 && ((stepSignalBuffer[0] >= alertLevel && psb < alertLevel) || (stepSignalBuffer[0] <= -alertLevel && psb > -alertLevel)) )
	{
      Alert(Symbol()+" M("+Period()+") Signal level touched");
      ab = Bars;
	}
   psb = stepSignalBuffer[0];

	return(0);
 }
Sample
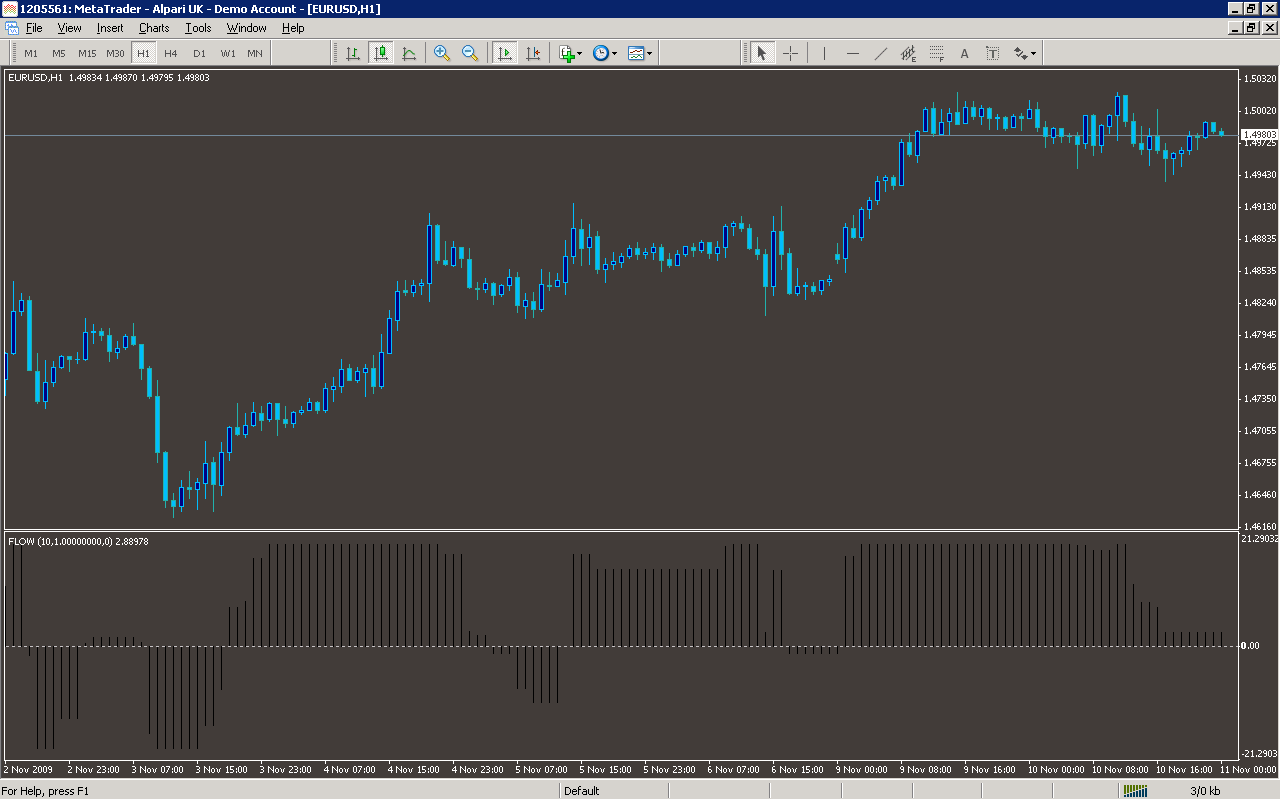
Analysis
Market Information Used:
Series array that contains the highest prices of each bar
Series array that contains the lowest prices of each bar
Series array that contains close prices for each bar
Indicator Curves created:
Implements a curve of type DRAW_HISTOGRAM
Implements a curve of type DRAW_LINE
Indicators Used:
Momentum indicator
Custom Indicators Used:
Order Management characteristics:
Other Features:
It issuies visual alerts to the screen