//+------------------------------------------------------------------+
//|                                                 SilverTrend .mq4 |
//|                             SilverTrend  rewritten by CrazyChart |
//|                                                 http://viac.ru/  |
//|                  modified by Kalenzo bartlomiej.gorski@gmail.com |
//|                  modified yet again by monkey nuts (Lowphat)     |
//+------------------------------------------------------------------+
#property copyright "SilverTrend  rewritten by CrazyChart"
#property link      "http://viac.ru/ "

#property indicator_separate_window
#property indicator_buffers 2
#property indicator_color1 Lime
#property indicator_color2 Red

extern int       SSP=7;
extern double    Kmax=50.6;

extern int       CountBars=300;

//---- buffers
double ExtMapBuffer1[];
double ExtMapBuffer2[];
double ExtHBuffer1[];
double ExtHBuffer2[];


//+------------------------------------------------------------------+
//| Custom indicator initialization function                         |
//+------------------------------------------------------------------+
int init()
  {
//---- indicators
   IndicatorBuffers(4);
   SetIndexStyle(0,DRAW_HISTOGRAM,0,2);  //Red
   SetIndexBuffer(0,ExtHBuffer1);
   SetIndexStyle(1,DRAW_HISTOGRAM,0,2);  //Aqua
   SetIndexBuffer(1,ExtHBuffer2);

   SetIndexBuffer(2,ExtMapBuffer1);
   SetIndexBuffer(3,ExtMapBuffer2);

   IndicatorShortName("FxTrend ("+SSP+")");

//----
   return(0);
  }
//+------------------------------------------------------------------+
//| Custor indicator deinitialization function                       |
//+------------------------------------------------------------------+
int deinit()
  {

   return(0);
  }
//+------------------------------------------------------------------+
//| Custom indicator iteration function                              |
//+------------------------------------------------------------------+
int start()
  {

  if (CountBars>=Bars) CountBars=Bars;

   SetIndexDrawBegin(0,Bars-CountBars+SSP);
   SetIndexDrawBegin(1,Bars-CountBars+SSP);

  int i, counted_bars=IndicatorCounted();
  double SsMax, SsMin, smin, smax;

  if(Bars<=SSP+1) return(0);

if(counted_bars<SSP+1)
   {
      for(i=1;i<=SSP;i++) ExtMapBuffer1[CountBars-i]=0.0;
      for(i=1;i<=SSP;i++) ExtMapBuffer2[CountBars-i]=0.0;
   }

for(i=CountBars-SSP;i>=0;i--) {


  SsMax = High[Highest(NULL,0,MODE_HIGH,SSP,i-SSP+1)];
  SsMin = Low[Lowest(NULL,0,MODE_LOW,SSP,i-SSP+1)];


   smax = SsMax-(SsMax-SsMin)*Kmax/100;

   ExtMapBuffer1[i-SSP+6]=smax;
   ExtMapBuffer2[i-SSP-1]=smax;

}
   for(int b=CountBars-SSP;b>=0;b--)
   {

      if(ExtMapBuffer1[b]>ExtMapBuffer2[b])
      {
         ExtHBuffer1[b]=1;
         ExtHBuffer2[b]=0;
      }
      else
      {
         ExtHBuffer1[b]=0;
         ExtHBuffer2[b]=-1;
      }

   }

return(0);
}
Sample
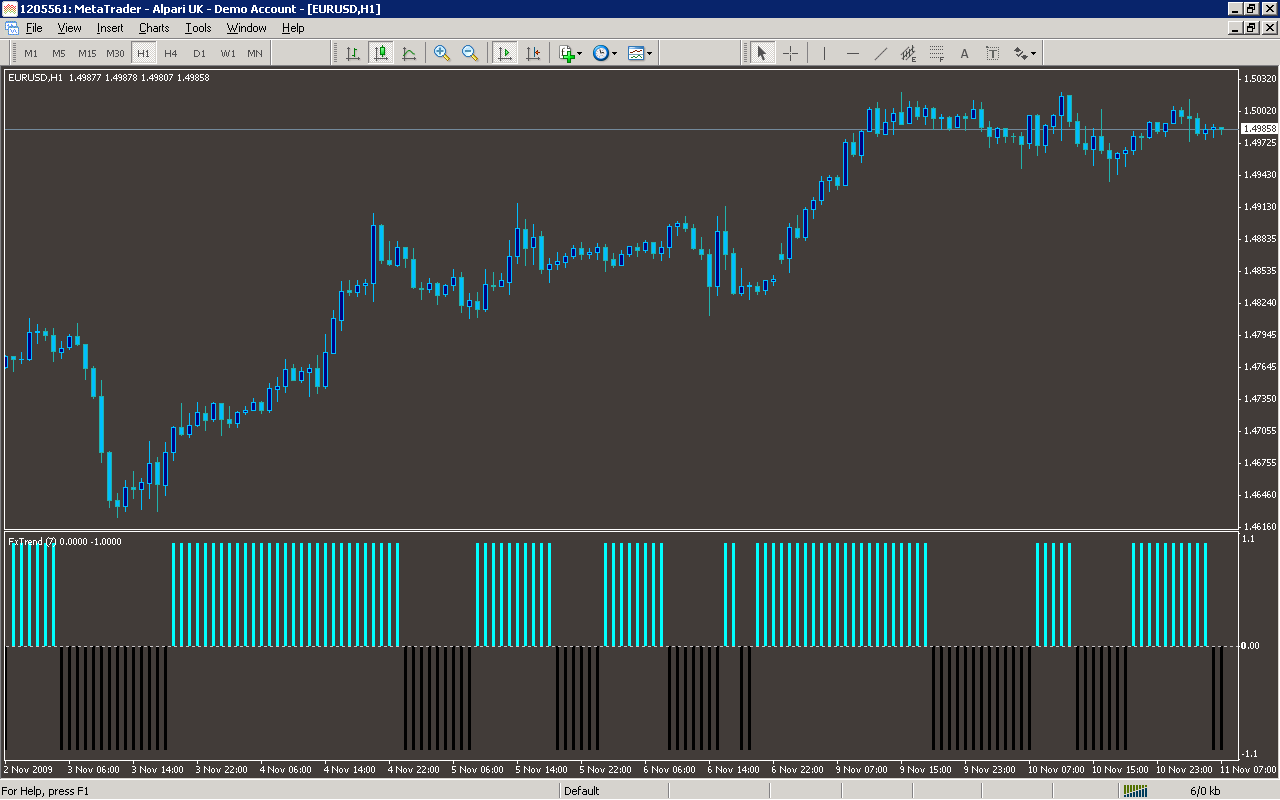
Analysis
Market Information Used:
Series array that contains the highest prices of each bar
Series array that contains the lowest prices of each bar
Indicator Curves created:
Implements a curve of type DRAW_HISTOGRAM
Indicators Used:
Custom Indicators Used:
Order Management characteristics:
Other Features: