//+------------------------------------------------------------------+
//|                                            Goertzel_Cycle_V1.mq4 |
//|                                                       Jojolalpin |
//| Realeased on www.forex-tsd.com                                   |
//| Makes Real Time cycles analysis applying Goertzel Algorithm      |
//|  15-02-2008                                                      |
//+------------------------------------------------------------------+
#property copyright "NONE - made by Jojolalpin"
#property link      "http://www.forex-tsd.com"

#property indicator_separate_window

#property indicator_buffers 3
#property indicator_color1 Red
#property indicator_style1 STYLE_SOLID
#property indicator_width1 2

#property indicator_color2 Orange
#property indicator_style2 STYLE_DOT
#property indicator_width2 1

#property indicator_color3 Blue
#property indicator_style3 STYLE_SOLID
#property indicator_width3 1

extern bool SquaredAmp = true;//To display squared amplitude or just the amplitude
extern int MaxPer = 500;     //Maximal period analysed
extern int MinPer = 1;        //Minimal period analysed
extern int bar2update = 1;    //Nombre de barres entre chaque update

double AmpBuf[];   //Amplitude buffer
double PhaBuf[];   //Phase Buffer
double PicBuf[];   //Amplitude peaks buffer
double FlatBuf[];  //Flattened close price buffer

int LastUpdate=0;
int digs=4;
string ShName="";
double PI=3.1415926535;

//+------------------------------------------------------------------+
//| Custom indicator initialization function                         |
//+------------------------------------------------------------------+
int init()
  {
  //Correct if needed MinPer and MaxPer
  if(MinPer<2) MinPer=2;
  if(MaxPer<MinPer) MaxPer=MinPer;
  //Correct if needed Bar2Update
  if(bar2update<0) bar2update=1;

//---- 1 additional buffer
   IndicatorBuffers(4);
   IndicatorDigits(digs);
//---- drawing settings
//---- 4 indicator buffers mapping
   SetIndexBuffer(0,AmpBuf);
   SetIndexBuffer(1,PhaBuf);
   SetIndexBuffer(2,PicBuf);
   SetIndexBuffer(3,FlatBuf);
//---- name for DataWindow and indicator subwindow label
   ShName="Goertzel Cycles("+MinPer+" to "+MaxPer+" Periods)";
   IndicatorShortName(ShName);

   if(SquaredAmp==true)
      SetIndexLabel(0,"PeakPer");
   else
      SetIndexLabel(0,"Amplitude");
      SetIndexLabel(1,"Phase");
      SetIndexLabel(2,"PeakPer"+digs);

   SetIndexEmptyValue(0,0.0);
   SetIndexEmptyValue(1,0.0);
   SetIndexEmptyValue(2,0.0);
   SetIndexEmptyValue(3,0.0);

   SetLevelStyle(STYLE_DOT,1,DarkGreen);
   SetLevelValue(1,PI);
   SetLevelValue(2,2*PI);

//---- initialization done
   return(0);
  }
//+------------------------------------------------------------------+
//| Custom indicator deinitialization function                       |
//+------------------------------------------------------------------+
int deinit()
  {
//----

//----
   return(0);
  }
//+------------------------------------------------------------------+
//| Custom indicator iteration function                              |
//+------------------------------------------------------------------+
int start()
  {

   //Check Enough Bars
   if(Bars<3*MaxPer)
   {
      Print(" Goertzel Cycle -- Not Enough bars! - you need 3*MaxPer -> " + DoubleToStr(3*MaxPer,0));
      return(0);
   }
   else
      IndicatorShortName(ShName);

   //Check bar2update
   if(bar2update<1) bar2update=1;
   //Check Update needed
   if(Time[0]-LastUpdate>=bar2update*Period()*60)
   {
      LastUpdate=Time[0];
      //----
      SetIndexDrawBegin(0,Bars-MaxPer-bar2update-1);
      SetIndexDrawBegin(1,Bars-MaxPer-bar2update-1);
      SetIndexDrawBegin(2,Bars-MaxPer-bar2update-1);

      //--- Call main function
      ComputeIt(1);
   }


//----
   return(0);
  }
//+------------------------------------------------------------------+
int ComputeIt(int x)
{
   int i;
   int j;
   int k;
   int l;
   double a;
   double b;
   double v0;
   double v1;
   double v2;
   double freq;
   double coeff;
   double real;
   double img;

   //---- Set buffers values to 0
   for(i=0;i<=MaxPer+2;i++)
   {
      AmpBuf[i]=0; PhaBuf[i]=0; PicBuf[i]=0.0;
   }
   //---- Set flatBuf to 0
   for(i=0;i<=3*MaxPer+2;i++)
   {
      FlatBuf[i]=0;
   }

   //Calculate flattened price
   a=Close[x+3*MaxPer-1];
   b=(Close[x]-a)/(x+3*MaxPer-2);
   for(i=3*MaxPer;i>=1;i--)
      FlatBuf[i]=Close[x+i-1]-(a+b*(3*MaxPer-i));

   //For each period we'll compute Amplitude and Phase
   for(i=MinPer; i<=MaxPer; i++)
   {
      v0=0; v1=0; v2=0;
      freq = MathPow(i,-1);
      coeff=2*MathCos(2*PI*freq);
      for(k=3*MaxPer; k>=1; k--)
      {
         v0=coeff*v1-v2+FlatBuf[k];
         v2=v1;
         v1=v0;
      }
      real=v1-v2*0.5*coeff;
      img = v2*MathSin(2*PI*freq);

      if(SquaredAmp==true)
         AmpBuf[i]=MathPow(real,2)+MathPow(img,2);
      else
         AmpBuf[i]=MathSqrt(MathPow(real,2)+MathPow(img,2));

      if(real!=0)
      {   PhaBuf[i]=MathArctan(img/real); }
      else
      {
        real=0.0000001;
        PhaBuf[i]=MathArctan(img/real);
      }
      //Correction of the phase found by arctan(img/real)
      if(real<0)
         PhaBuf[i]=PhaBuf[i]+PI;
      else
      {
         if(real>=0 && img<0)
            PhaBuf[i]=PhaBuf[i]+2*PI;
      }

   }

   //We check for amplitude peaks and tag them
   for(i=MinPer+1; i<MaxPer; i++)
   {
      if(AmpBuf[i]>AmpBuf[i+1] && AmpBuf[i]>AmpBuf[i-1])
         PicBuf[i]=i*MathPow(10,-1*digs);
      else
         PicBuf[i]=0.0;
   }

   return(0);
}
Sample
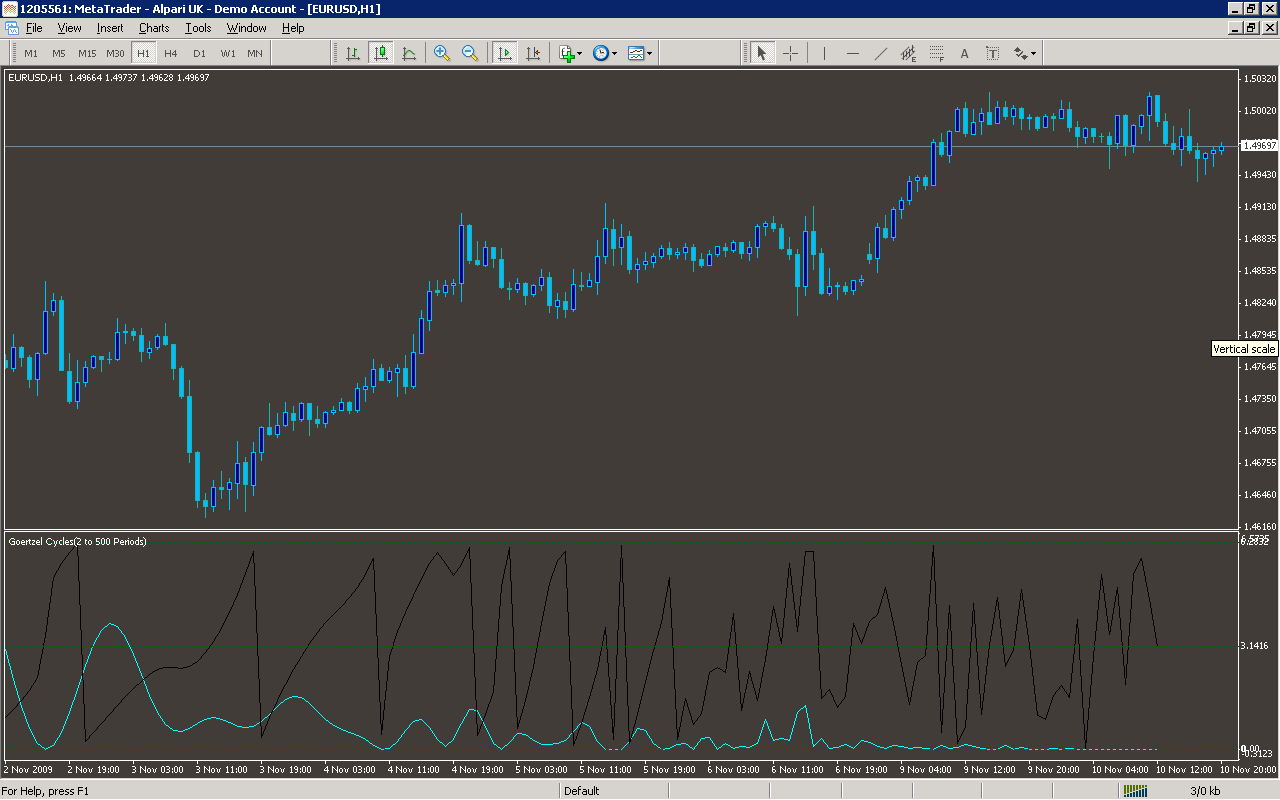
Analysis
Market Information Used:
Series array that contains open time of each bar
Series array that contains close prices for each bar
Indicator Curves created:
Indicators Used:
Custom Indicators Used:
Order Management characteristics:
Other Features: