//+------------------------------------------------------------------+
//|                                                         Grid.mq4 |
//|                                                          4xcoder |
//|                                              4xcoder@4xcoder.com |
//+------------------------------------------------------------------+
#property copyright "4xcoder"
#property link      "4xcoder@4xcoder.com"

#property indicator_chart_window
//---- input parameters
extern int       HGrid.Weeks=10;       // Period over which to calc High/Low of gird
extern int       HGrid.Pips=20;        // Size of grid in Pips
extern color     HLine=DimGray;        // Color of grid
extern color     HLine2=DarkGreen;     // Every 100 pips, change grid color to this.

extern int       GridTime=15;          // Number of periods (days or weeks) to draw time grid
extern int       TimeGrid=PERIOD_H4;   // Grid period in minutes
extern int       ColorHour=16;         // For hour grids, draw color line at this hour (broker time)
extern color     TimeLine=DimGray;     // Color of grid
extern color     TimeLine2=DarkGreen;  // Color of special bars

// Recommends settings:
// 1 minute - HGrid.Pips=10, TimeGrid = 10
// 5, 15 minutes - HGrid.Pips=20, TimeGrid= PERIOD_H1 (60)
// 30, 60 minutes - HGrid.Pips=20, TimeGrid = PERIOD_H4 (240) or 2 hours (120)
// 4 hour - HGrid.Pips=50, TimeGrid = PERIOD_D1 (1440) or 12 hours (720)
// 1 day - HGrid.Pips=50, TimeGrid = PERIOD_W1 (10800).


bool firstTime = true;
datetime lastTime = 0;
//+------------------------------------------------------------------+
//| Custom indicator iteration function                              |
//+------------------------------------------------------------------+
int start()
  {
   int    counted_bars=IndicatorCounted();
//----
   if ( true /*lastTime == 0 || CurTime() - lastTime > 5*/ ) {
      firstTime = false;
      lastTime = CurTime();

      if ( HGrid.Weeks > 0 && HGrid.Pips > 0 ) {
         double weekH = iHigh( NULL, PERIOD_W1, 0 );
         double weekL = iLow( NULL, PERIOD_W1, 0 );

         for ( int i = 1; i < HGrid.Weeks; i++ ) {
            weekH = MathMax( weekH, iHigh( NULL, PERIOD_W1, i ) );
            weekL = MathMin( weekL, iLow( NULL, PERIOD_W1, i ) );
         }

         double pipRange = HGrid.Pips * Point;
         if ( Symbol() == "GOLD" )
            pipRange = pipRange * 10.0;

         double topPips = (weekH + pipRange) - MathMod( weekH, pipRange );
         double botPips = weekL - MathMod( weekL, pipRange );

         for ( double p = botPips; p <= topPips; p += pipRange ) {
            string gridname = "grid_" + DoubleToStr( p, Digits );
            ObjectCreate( gridname, OBJ_HLINE, 0, 0, p );

            double pp = p / Point;
            int pInt = MathRound( pp );
            int mod = 100;
            if ( Symbol() == "GOLD" )
               mod = 1000;
            if ( (pInt % mod) == 0 )
               ObjectSet( gridname, OBJPROP_COLOR, HLine2 );
            else
               ObjectSet( gridname, OBJPROP_COLOR, HLine );
            ObjectSet( gridname, OBJPROP_STYLE, STYLE_DOT );
            ObjectSet( gridname, OBJPROP_PRICE1, p );
            ObjectSet( gridname, OBJPROP_BACK, true );
         }
      }

   }

   datetime start;
   if ( TimeGrid == PERIOD_W1 ) {
      int weekCount = GridTime - 1;
      int bar=0;
      while ( weekCount >= 0 && bar < Bars ) {
         if ( TimeDayOfWeek( Time[bar] ) == 1 && TimeHour( Time[bar] ) == 0  ) {
            start = Time[bar];
            gridname = "grid_" + DoubleToStr( start, 0 );
            ObjectCreate( gridname, OBJ_VLINE, 0, start, 0 );
            if ( TimeHour( start ) == ColorHour && TimeMinute( start ) == 0 )
               ObjectSet( gridname, OBJPROP_COLOR, TimeLine2 );
            else
               ObjectSet( gridname, OBJPROP_COLOR, TimeLine );
            ObjectSet( gridname, OBJPROP_STYLE, STYLE_DASHDOTDOT );
            ObjectSet( gridname, OBJPROP_TIME1, start );
            ObjectSet( gridname, OBJPROP_BACK, true );
            weekCount--;
         }
         bar++;
      }
   }

   if ( TimeGrid > 0 ) {
      start = Time[0];
      int skip = TimeGrid * 60;

      start = start - (start % skip) + skip;

      int thisDay = TimeDay( start );
      int dayCount = GridTime - 1;

      while ( dayCount >= 0 ) {
         gridname = "grid_" + DoubleToStr( start, 0 );
         ObjectCreate( gridname, OBJ_VLINE, 0, start, 0 );
         if ( TimeHour( start ) == ColorHour && TimeMinute( start ) == 0 )
            ObjectSet( gridname, OBJPROP_COLOR, TimeLine2 );
         else
            ObjectSet( gridname, OBJPROP_COLOR, TimeLine );
         ObjectSet( gridname, OBJPROP_STYLE, STYLE_DASHDOTDOT );
         ObjectSet( gridname, OBJPROP_TIME1, start );
         ObjectSet( gridname, OBJPROP_BACK, true );

         start = start - skip;
         if ( TimeDay( start ) != thisDay ) {
            dayCount--;
            thisDay = TimeDay( start );
         }
      }

   }

//----
   return(0);
  }

//+------------------------------------------------------------------+
//| Custom indicator initialization function                         |
//+------------------------------------------------------------------+
int init()
  {
//---- indicators
   firstTime = true;
//----
   return(0);
  }
//+------------------------------------------------------------------+
//| Custom indicator deinitialization function                       |
//+------------------------------------------------------------------+
int deinit()
  {
//----

   for ( int i = ObjectsTotal() - 1; i >= 0; i-- ) {
      string name = ObjectName( i );
      if ( StringFind( name, "grid_" ) >= 0 )
         ObjectDelete( name );
   }

//----
   return(0);
  }
//+------------------------------------------------------------------+
Sample
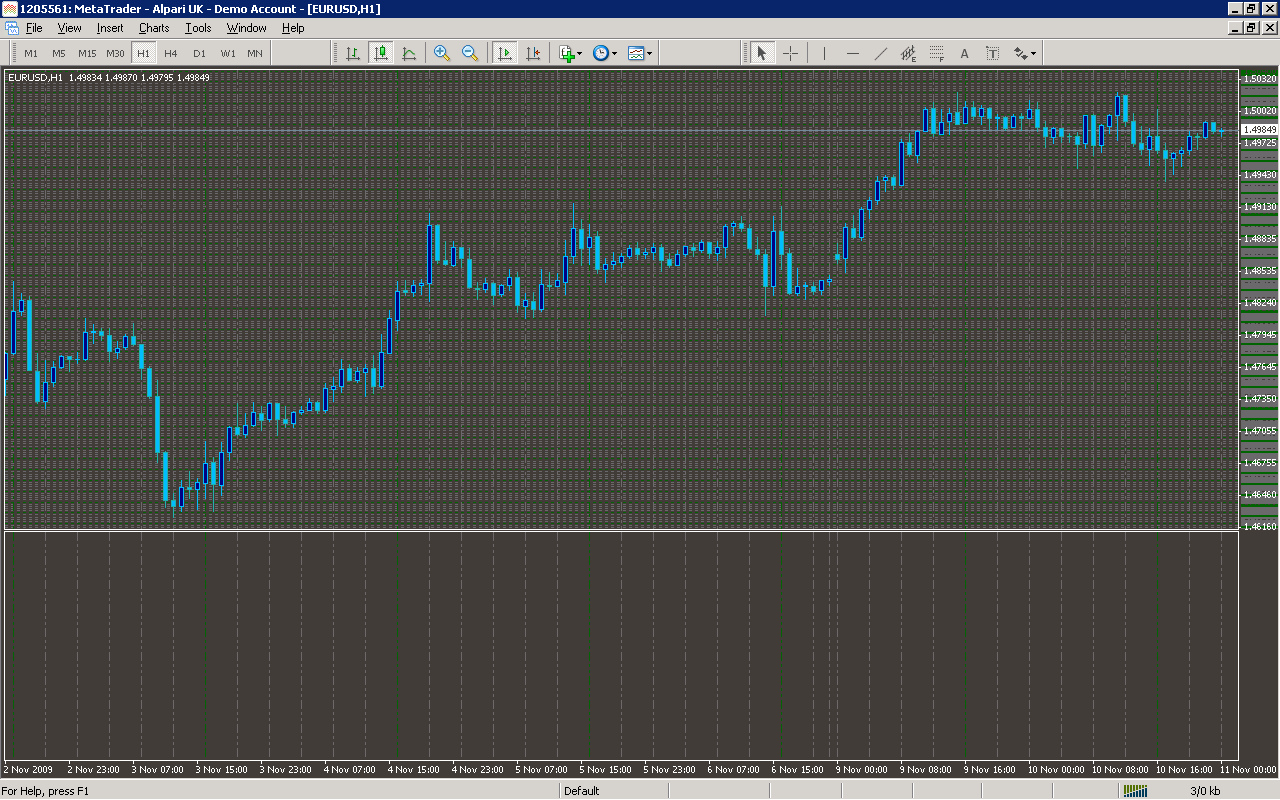
Analysis
Market Information Used:
Series array that contains the highest prices of each bar
Series array that contains the lowest prices of each bar
Series array that contains open time of each bar
Indicator Curves created:
Indicators Used:
Custom Indicators Used:
Order Management characteristics:
Other Features: