//+------------------------------------------------------------------+
//| Heiken Ashi.mq4 |
//| Copyright © 2004, MetaQuotes Software Corp. |
//| http://www.metaquotes.net |
//+------------------------------------------------------------------+
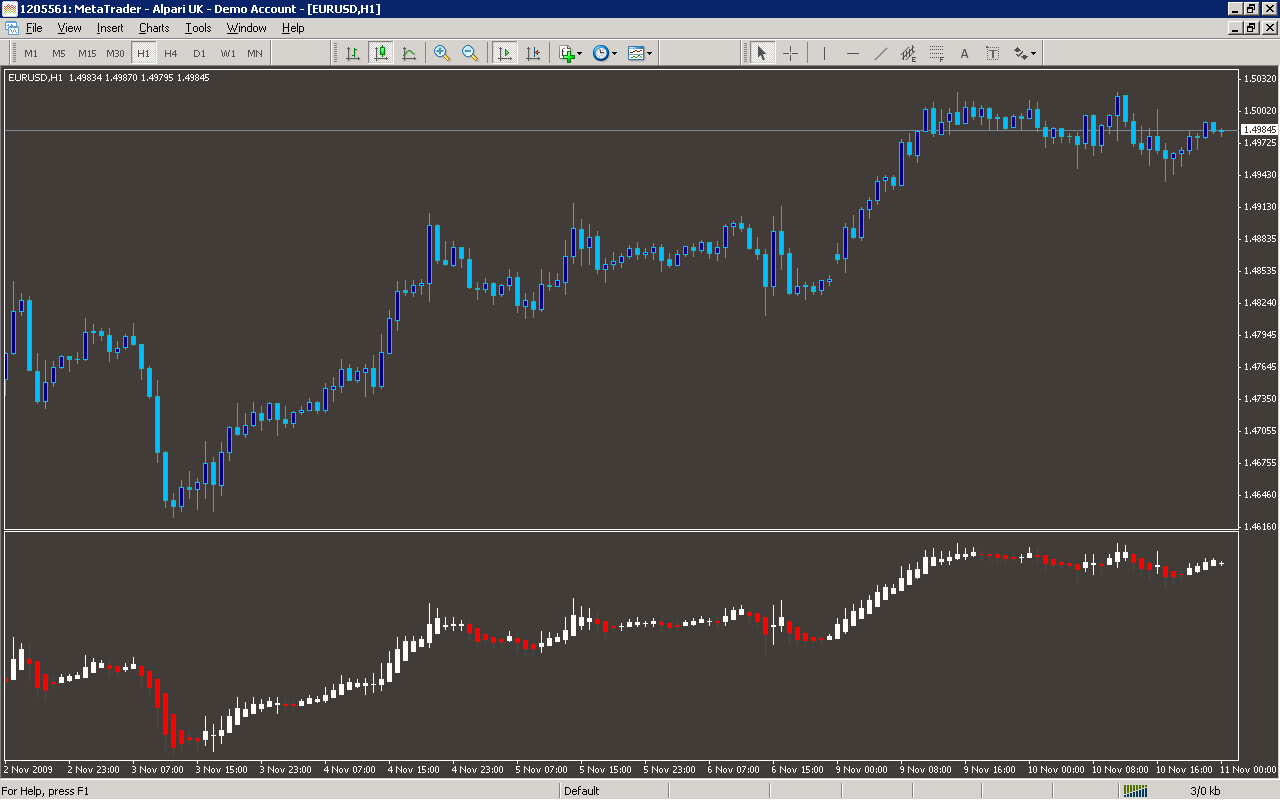
//| For Heiken Ashi we recommend next chart settings ( press F8 or |
//| select on menu 'Charts'->'Properties...'): |
//| - On 'Color' Tab select 'Black' for 'Line Graph' |
//| - On 'Common' Tab disable 'Chart on Foreground' checkbox and |
//| select 'Line Chart' radiobutton |
//+------------------------------------------------------------------+
#property copyright "Copyright © 2004, MetaQuotes Software Corp."
#property link "http://www.metaquotes.net"
#property indicator_chart_window
#property indicator_buffers 4
#property indicator_color1 Red
#property indicator_color2 White
#property indicator_color3 Red
#property indicator_color4 White
//---- buffers
double ExtMapBuffer1[];
double ExtMapBuffer2[];
double ExtMapBuffer3[];
double ExtMapBuffer4[];
//----
int ExtCountedBars=0;
//+------------------------------------------------------------------+
//| Custom indicator initialization function |
//|------------------------------------------------------------------|
int init()
{
//---- indicators
SetIndexStyle(0,DRAW_HISTOGRAM, 0, 1, Red);
SetIndexBuffer(0, ExtMapBuffer1);
SetIndexStyle(1,DRAW_HISTOGRAM, 0, 1, White);
SetIndexBuffer(1, ExtMapBuffer2);
SetIndexStyle(2,DRAW_HISTOGRAM, 0, 3, Red);
SetIndexBuffer(2, ExtMapBuffer3);
SetIndexStyle(3,DRAW_HISTOGRAM, 0, 3, White);
SetIndexBuffer(3, ExtMapBuffer4);
//----
SetIndexDrawBegin(0,10);
SetIndexDrawBegin(1,10);
SetIndexDrawBegin(2,10);
SetIndexDrawBegin(3,10);
//---- indicator buffers mapping
SetIndexBuffer(0,ExtMapBuffer1);
SetIndexBuffer(1,ExtMapBuffer2);
SetIndexBuffer(2,ExtMapBuffer3);
SetIndexBuffer(3,ExtMapBuffer4);
//---- initialization done
return(0);
}
//+------------------------------------------------------------------+
//| Custor indicator deinitialization function |
//+------------------------------------------------------------------+
int deinit()
{
//---- TODO: add your code here
//----
return(0);
}
//+------------------------------------------------------------------+
//| Custom indicator iteration function |
//+------------------------------------------------------------------+
int start()
{
double haOpen, haHigh, haLow, haClose;
if(Bars<=10) return(0);
ExtCountedBars=IndicatorCounted();
//---- check for possible errors
if (ExtCountedBars<0) return(-1);
//---- last counted bar will be recounted
if (ExtCountedBars>0) ExtCountedBars--;
int pos=Bars-ExtCountedBars-1;
while(pos>=0)
{
haOpen=(ExtMapBuffer3[pos+1]+ExtMapBuffer4[pos+1])/2;
haClose=(Open[pos]+High[pos]+Low[pos]+Close[pos])/4;
haHigh=MathMax(High[pos], MathMax(haOpen, haClose));
haLow=MathMin(Low[pos], MathMin(haOpen, haClose));
if (haOpen<haClose)
{
ExtMapBuffer1[pos]=haLow;
ExtMapBuffer2[pos]=haHigh;
}
else
{
ExtMapBuffer1[pos]=haHigh;
ExtMapBuffer2[pos]=haLow;
}
ExtMapBuffer3[pos]=haOpen;
ExtMapBuffer4[pos]=haClose;
pos--;
}
//----
return(0);
}
//+------------------------------------------------------------------+
Sample
Analysis
Market Information Used:
Series array that contains close prices for each bar
Series array that contains the highest prices of each bar
Series array that contains the lowest prices of each bar
Series array that contains open prices of each bar
Indicator Curves created:
Implements a curve of type DRAW_HISTOGRAM
Indicators Used:
Custom Indicators Used:
Order Management characteristics:
Other Features: