//+------------------------------------------------------------------+
//|                                             StepMA_Stoch_KV1.mq4 |
//|                           Copyright © 2005, TrendLaboratory Ltd. |
//|                                       E-mail: igorad2004@list.ru |
//|                           modified by Kalenzo -> simone@konto.pl |
//+------------------------------------------------------------------+
#property copyright "Copyright © 2005, TrendLaboratory Ltd."
#property link      "E-mail: igorad2004@list.ru"

#property indicator_separate_window
#property indicator_buffers 2
#property indicator_color1 Red
#property indicator_color2 Green

//#property indicator_minimum -1
//#property indicator_maximum 1

//---- input parameters
extern int PeriodWATR=10;
extern double Kwatr=1.0000;
extern int HighLow=0;
extern int NumberOfBarsToCalculate = 500;
//---- indicator buffers
double LineMinBuffer[];
double LineMidBuffer[];
//+------------------------------------------------------------------+
//| Custom indicator initialization function                         |
//+------------------------------------------------------------------+
  int init()
  {
 Comment("");
//---- indicator line
   SetIndexStyle(0,DRAW_HISTOGRAM,STYLE_SOLID,2);
   SetIndexStyle(1,DRAW_HISTOGRAM,STYLE_SOLID,2);
   SetIndexBuffer(0,LineMinBuffer);
   SetIndexBuffer(1,LineMidBuffer);
   IndicatorDigits(MarketInfo(Symbol(),MODE_DIGITS));
//---- name for DataWindow and indicator subwindow label
   //short_name="StepMA Stoch("+PeriodWATR+","+Kwatr+","+HighLow+")";
   SetIndexLabel(0,"StepMA Stoch 1");
   SetIndexLabel(1,"StepMA Stoch 2");
//----
   SetIndexDrawBegin(0,PeriodWATR);
   SetIndexDrawBegin(1,PeriodWATR);
   ArrayInitialize(LineMinBuffer,0);
   ArrayInitialize(LineMidBuffer,0);
   SetIndexEmptyValue(0,0);
   SetIndexEmptyValue(1,0);
//----
   return(0);
  }

//+------------------------------------------------------------------+
//| StepMA_3D_v1                                                         |
//+------------------------------------------------------------------+
int start()
  {
      string short_name;
      short_name = "Max bars to count: |"+(Bars-1)+"| ";
      IndicatorShortName(short_name);

   int      i,shift,TrendMin,TrendMax,TrendMid;
   double   SminMin0,SmaxMin0,SminMin1,SmaxMin1,SumRange,dK,WATR0,WATRmax,WATRmin,WATRmid;
   double   SminMax0,SmaxMax0,SminMax1,SmaxMax1,SminMid0,SmaxMid0,SminMid1,SmaxMid1;
   double   linemin,linemax,linemid,Stoch1,Stoch2,bsmin,bsmax;

   double prev_y = 0,prev_b = 0;

   for(shift=NumberOfBarsToCalculate-1;shift>=0;shift--)
   {
	SumRange=0;
	for (i=PeriodWATR-1;i>=0;i--)
	    {
       dK = 1+1.0*(PeriodWATR-i)/PeriodWATR;
       SumRange+= dK*MathAbs(High[i+shift]-Low[i+shift]);
       }
	WATR0 = SumRange/PeriodWATR;

	WATRmax=MathMax(WATR0,WATRmax);
	if (shift==NumberOfBarsToCalculate-1-PeriodWATR) WATRmin=WATR0;
	WATRmin=MathMin(WATR0,WATRmin);

	int StepSizeMin=MathRound(Kwatr*WATRmin/Point);
	int StepSizeMax=MathRound(Kwatr*WATRmax/Point);
	int StepSizeMid=MathRound(Kwatr*0.5*(WATRmax+WATRmin)/Point);

	if (HighLow>0)
	  {
	  SmaxMin0=Low[shift]+2*StepSizeMin*Point;
	  SminMin0=High[shift]-2*StepSizeMin*Point;

	  SmaxMax0=Low[shift]+2*StepSizeMax*Point;
	  SminMax0=High[shift]-2*StepSizeMax*Point;

	  SmaxMid0=Low[shift]+2*StepSizeMid*Point;
	  SminMid0=High[shift]-2*StepSizeMid*Point;

	  if(Close[shift]>SmaxMin1) TrendMin=1;
	  if(Close[shift]<SminMin1) TrendMin=-1;

	  if(Close[shift]>SmaxMax1) TrendMax=1;
	  if(Close[shift]<SminMax1) TrendMax=-1;

	  if(Close[shift]>SmaxMid1) TrendMid=1;
	  if(Close[shift]<SminMid1) TrendMid=-1;
	  }

	if (HighLow == 0)
	  {
	  SmaxMin0=Close[shift]+2*StepSizeMin*Point;
	  SminMin0=Close[shift]-2*StepSizeMin*Point;

	  SmaxMax0=Close[shift]+2*StepSizeMax*Point;
	  SminMax0=Close[shift]-2*StepSizeMax*Point;

	  SmaxMid0=Close[shift]+2*StepSizeMid*Point;
	  SminMid0=Close[shift]-2*StepSizeMid*Point;

	  if(Close[shift]>SmaxMin1) TrendMin=1;
	  if(Close[shift]<SminMin1) TrendMin=-1;

	  if(Close[shift]>SmaxMax1) TrendMax=1;
	  if(Close[shift]<SminMax1) TrendMax=-1;

	  if(Close[shift]>SmaxMid1) TrendMid=1;
	  if(Close[shift]<SminMid1) TrendMid=-1;
	  }

	  if(TrendMin>0 && SminMin0<SminMin1) SminMin0=SminMin1;
	  if(TrendMin<0 && SmaxMin0>SmaxMin1) SmaxMin0=SmaxMin1;

	  if(TrendMax>0 && SminMax0<SminMax1) SminMax0=SminMax1;
	  if(TrendMax<0 && SmaxMax0>SmaxMax1) SmaxMax0=SmaxMax1;

	  if(TrendMid>0 && SminMid0<SminMid1) SminMid0=SminMid1;
	  if(TrendMid<0 && SmaxMid0>SmaxMid1) SmaxMid0=SmaxMid1;


	  if (TrendMin>0) linemin=SminMin0+StepSizeMin*Point;
	  if (TrendMin<0) linemin=SmaxMin0-StepSizeMin*Point;

	  if (TrendMax>0) linemax=SminMax0+StepSizeMax*Point;
	  if (TrendMax<0) linemax=SmaxMax0-StepSizeMax*Point;

	  if (TrendMid>0) linemid=SminMid0+StepSizeMid*Point;
	  if (TrendMid<0) linemid=SmaxMid0-StepSizeMid*Point;

	  bsmin=linemax-StepSizeMax*Point;
	  bsmax=linemax+StepSizeMax*Point;
	  Stoch1=NormalizeDouble((linemin-bsmin)/(bsmax-bsmin),6);
	  Stoch2=NormalizeDouble((linemid-bsmin)/(bsmax-bsmin),6);
	  prev_y = (Stoch1 - Stoch2);
	  if(prev_y<0.0){
	     LineMinBuffer[shift] = prev_y;
	     LineMidBuffer[shift] = 0;
	     }
	  else if(prev_y>0.0){
	     LineMidBuffer[shift] = prev_y;
	     LineMinBuffer[shift] = 0;
	     }

	  //prev_y = Stoch1;
	  //prev_b = Stoch2;


	  SminMin1=SminMin0;
	  SmaxMin1=SmaxMin0;

	  SminMax1=SminMax0;
	  SmaxMax1=SmaxMax0;

	  SminMid1=SminMid0;
	  SmaxMid1=SmaxMid0;
	 }
	return(0);
 }
Sample
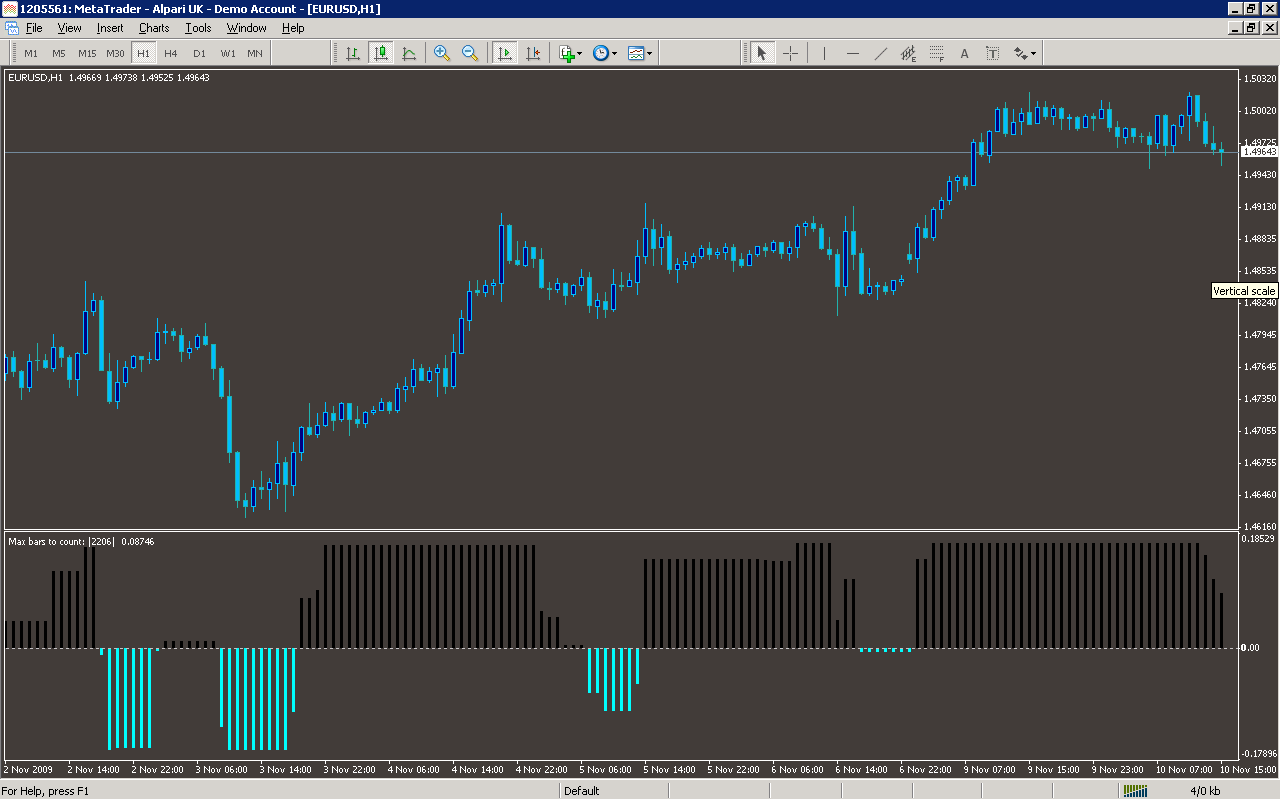
Analysis
Market Information Used:
Series array that contains the highest prices of each bar
Series array that contains the lowest prices of each bar
Series array that contains close prices for each bar
Indicator Curves created:
Implements a curve of type DRAW_HISTOGRAM
Indicators Used:
Custom Indicators Used:
Order Management characteristics:
Other Features: