//+------------------------------------------------------------------+
//|                                              HistoStepSto_v1.mq4 |
//|                                Copyright © 2006, TrendLaboratory |
//|            http://finance.groups.yahoo.com/group/TrendLaboratory |
//|                                   E-mail: igorad2003@yahoo.co.uk |
//|            Thanks to Nikolay Kositsin for good reversal tecnique |
//+------------------------------------------------------------------+
#property copyright "Copyright © 2006, TrendLaboratory"
#property link      "http://finance.groups.yahoo.com/group/TrendLaboratory"

#property indicator_separate_window
#property indicator_buffers 2
#property indicator_color1 DeepSkyBlue
#property indicator_color2 Tomato
#property indicator_width1 3
#property indicator_width2 3
#property indicator_maximum  30
#property indicator_minimum -30

//---- input parameters
extern int     Length      = 10;    // Volty Length
extern double  Kfast       =  1;    // Sensivity Factor for Fast Line
extern double  Kslow       =  1;    // Sensivity Factor for Slow Line
extern int     MA_Mode     =  0;    // Volty MA Mode : 0-SMA, 1-LWMA
extern int     StepSizeMIN =  0;    // Minimum Step Size  (if need)
extern int     StepSizeMAX =  0;    // Maximum Step Size  (if need)
extern double  Filter      =  0;    // Filter value in units
//---- indicator buffers
double UpTrendBuffer[];
double DnTrendBuffer[];
double SminMin[],SmaxMin[],SminMax[],SmaxMax[],SminMid[],SmaxMid[];

int    time[2],TRENDMIN[2],TRENDMID[2],TRENDMAX[2];
bool   Expert=true;
double ATR0,ATRmax=0,ATRmin=100000;
//+------------------------------------------------------------------+
//| Custom indicator initialization function                         |
//+------------------------------------------------------------------+
  int init()
  {
   string short_name;
//---- indicator line
   IndicatorBuffers(8);
   SetIndexStyle(0,DRAW_HISTOGRAM);
   SetIndexStyle(1,DRAW_HISTOGRAM);
   SetIndexBuffer(0,UpTrendBuffer);
   SetIndexBuffer(1,DnTrendBuffer);
   SetIndexBuffer(2,SminMin);
   SetIndexBuffer(3,SmaxMin);
   SetIndexBuffer(4,SminMax);
   SetIndexBuffer(5,SmaxMax);
   SetIndexBuffer(6,SminMid);
   SetIndexBuffer(7,SmaxMid);

//---- name for DataWindow and indicator subwindow label
   short_name="StepSto v2("+DoubleToStr(Kfast,2)+","+DoubleToStr(Kslow,2)+")";
   IndicatorShortName(short_name);
   SetIndexLabel(0,"StepSto UpTrend");
   SetIndexLabel(1,"StepSto DownTrend");
//----
   SetIndexDrawBegin(0,Length);
   SetIndexDrawBegin(1,Length);
//----
   return(0);
  }

//+------------------------------------------------------------------+
//| HistoStepSto_v1                                                       |
//+------------------------------------------------------------------+
int start()
{
   int      shift, TrendMin,TrendMax,TrendMid,MaxBar,limit,counted_bars=IndicatorCounted();

   double   linemin,linemax,linemid,bsmin,bsmax, StoFast, StoSlow;
   double   StepSizeMin, StepSizeMax,StepSizeMid;

   if (Bars-1<Length+1)return(0);
   if (counted_bars<0)return(-1);

   if (counted_bars>0) counted_bars--;

   MaxBar=Bars-1-Length-1;
   limit=Bars-counted_bars-1;

   if (limit>MaxBar)
   {
      for (shift=limit;shift>=MaxBar;shift--)
      {
      UpTrendBuffer[Bars-shift]=0;
      DnTrendBuffer[Bars-shift]=0;
      }
   limit=MaxBar;
   }

	//----
   int Tnew=Time[limit+1];

   if (limit<MaxBar)
      if (Tnew==time[1])
      {
      TrendMin=TRENDMIN[1];
      TrendMid=TRENDMID[1];
      TrendMax=TRENDMAX[1];
      Expert=false;
      }
      else
      if (Tnew==time[0])
      {
      TrendMin=TRENDMIN[0];
      TrendMid=TRENDMID[0];
      TrendMax=TRENDMAX[0];

      TRENDMIN[1]=TRENDMIN[0];
      TRENDMID[1]=TRENDMID[0];
      TRENDMAX[1]=TRENDMAX[0];
      }
   else
   {
   if (Tnew>time[1])Print("ERROR01");
   else Print("ERROR02");
   return(-1);
   }


	for(shift=limit;shift>=0;shift--)
   {

	double AvgRange=0;
	double Weight = 0;
	  for (int i=Length-1;i>=0;i--)
	  {
     if(MA_Mode==0) double alfa= 1.0; else alfa= 1.0*(Length-i)/Length;
     AvgRange+= alfa*(High[shift+i]-Low[shift+i]);
     Weight += alfa;
     }
	  ATR0 = AvgRange/Weight;

	if (ATR0>ATRmax) ATRmax=ATR0;
	if (ATR0<ATRmin) ATRmin=ATR0;

	if (StepSizeMIN > 0) ATRmin = StepSizeMIN*Point;
	if (StepSizeMAX > 0) ATRmax = StepSizeMAX*Point;

	StepSizeMin=(Kfast*ATRmin);
	StepSizeMax=(Kfast*ATRmax);
	StepSizeMid=(Kfast*0.5*Kslow*(ATRmax+ATRmin));

	SmaxMin[shift]=Close[shift]+2.0*StepSizeMin;
	SminMin[shift]=Close[shift]-2.0*StepSizeMin;

	SmaxMax[shift]=Close[shift]+2.0*StepSizeMax;
	SminMax[shift]=Close[shift]-2.0*StepSizeMax;

	SmaxMid[shift]=Close[shift]+2.0*StepSizeMid;
	SminMid[shift]=Close[shift]-2.0*StepSizeMid;

	if(Close[shift]>SmaxMin[shift+1]) TrendMin=1;
	if(Close[shift]<SminMin[shift+1]) TrendMin=-1;

	if(Close[shift]>SmaxMax[shift+1]) TrendMax=1;
	if(Close[shift]<SminMax[shift+1]) TrendMax=-1;

	if(Close[shift]>SmaxMid[shift+1]) TrendMid=1;
	if(Close[shift]<SminMid[shift+1]) TrendMid=-1;


	  if(TrendMin>0)
	  {
	  if(SminMin[shift]<SminMin[shift+1]) SminMin[shift]=SminMin[shift+1];
	  linemin=SminMin[shift]+StepSizeMin;
	  }
	  if(TrendMin<0)
	  {
	  if(SmaxMin[shift]>SmaxMin[shift+1]) SmaxMin[shift]=SmaxMin[shift+1];
	  linemin=SmaxMin[shift]-StepSizeMin;
	  }
	  if(TrendMax>0)
	  {
	  if(SminMax[shift]<SminMax[shift+1]) SminMax[shift]=SminMax[shift+1];
	  linemax=SminMax[shift]+StepSizeMax;
	  }

	  if(TrendMax<0)
	  {
	  if(SmaxMax[shift]>SmaxMax[shift+1]) SmaxMax[shift]=SmaxMax[shift+1];
	  linemax=SmaxMax[shift]-StepSizeMax;
	  }

	  if(TrendMid>0)
	  {
	  if(SminMid[shift]<SminMid[shift+1]) SminMid[shift]=SminMid[shift+1];
	  linemid=SminMid[shift]+StepSizeMid;
	  }

	  if(TrendMid<0)
	  {
	  if(SmaxMid[shift]>SmaxMid[shift+1]) SmaxMid[shift]=SmaxMid[shift+1];
	  linemid=SmaxMid[shift]-StepSizeMid;
	  }

	bsmin=linemax-StepSizeMax;
	bsmax=linemax+StepSizeMax;

	if (bsmax-bsmin>0) StoFast=100*(linemin-bsmin)/(bsmax-bsmin);
	if (bsmax-bsmin>0) StoSlow=100*(linemid-bsmin)/(bsmax-bsmin);

	if (StoFast-StoSlow > Filter)
	{
	UpTrendBuffer[shift] = StoFast-StoSlow;
	DnTrendBuffer[shift] = 0;
	}
	else
	if (StoFast-StoSlow > 0 && StoFast-StoSlow <= Filter)
	{
	UpTrendBuffer[shift] = 0;
	DnTrendBuffer[shift] = 0;
	}

	if (StoSlow-StoFast > Filter)
	{
	DnTrendBuffer[shift] = StoFast-StoSlow;
	UpTrendBuffer[shift] = 0;
	}
	else
	if (StoSlow-StoFast>0 && StoSlow-StoFast <= Filter)
	{
	DnTrendBuffer[shift] = 0;
	UpTrendBuffer[shift] = 0;
	}

	  if ((shift==2)||((shift==1)&&(Expert==true)))
      {
      time [shift-1]=Time [shift];

      TRENDMIN[shift-1]=TrendMin;
      TRENDMID[shift-1]=TrendMid;
      TRENDMAX[shift-1]=TrendMax;
      }
   }
	return(0);
}
Sample
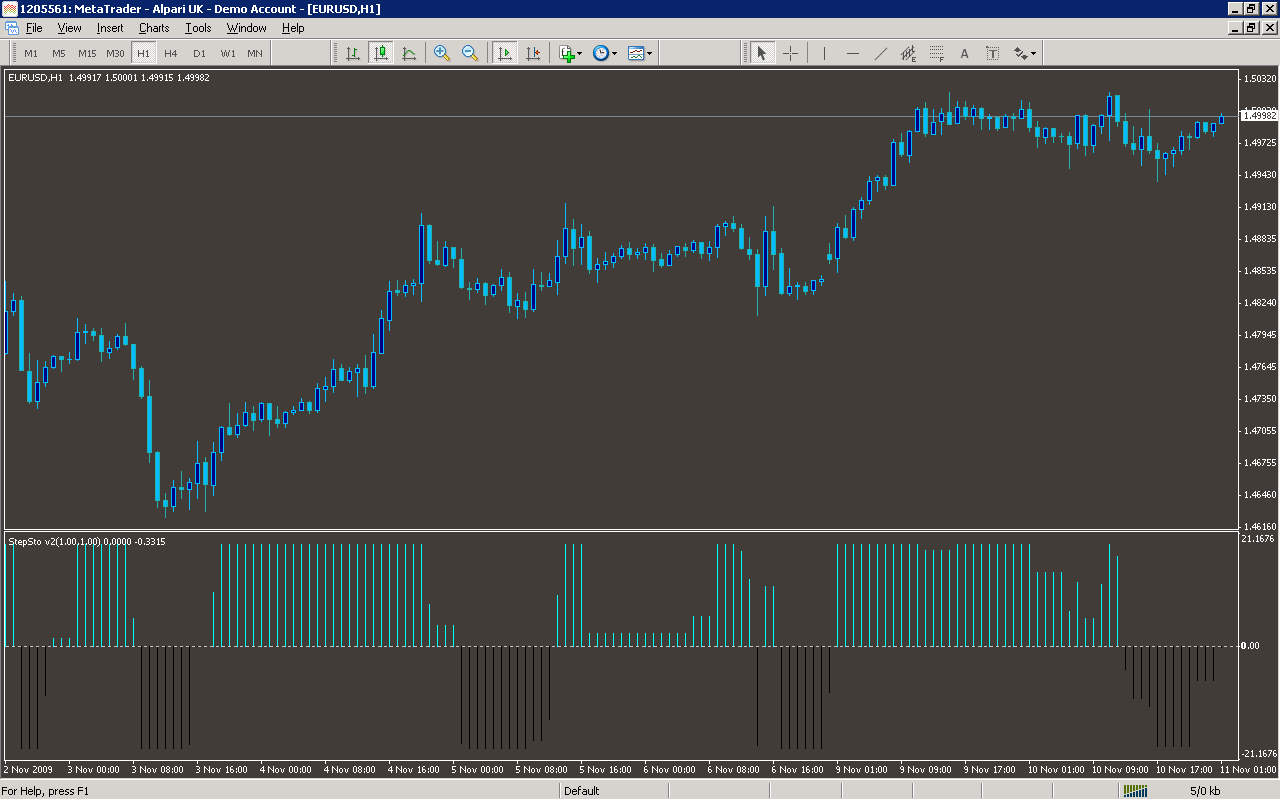
Analysis
Market Information Used:
Series array that contains open time of each bar
Series array that contains the highest prices of each bar
Series array that contains the lowest prices of each bar
Series array that contains close prices for each bar
Indicator Curves created:
Implements a curve of type DRAW_HISTOGRAM
Indicators Used:
Custom Indicators Used:
Order Management characteristics:
Other Features: