//+------------------------------------------------------------------+
//|                                               IND Inverse.mq4 |
//+------------------------------------------------------------------+
#property copyright "Copyright Š 2006, ..."
#property link      "http://www.forex-tsd.com/"

#property indicator_separate_window
#property indicator_buffers 2
#property indicator_color1 Silver
#property indicator_color2 Red

//---- input parameters
//---- buffers
double Buffer[];
double EMA[];
extern int iPeriod = 1;
extern int EMAPeriod=25;

//----
//+------------------------------------------------------------------+
//| Init                                                             |
//+------------------------------------------------------------------+
int init()
{
//---- indicators
    string short_name;
    short_name="IND Inverse + EMA("+iPeriod+","+EMAPeriod+")";
    IndicatorShortName(short_name);
    IndicatorDigits(Digits+2);
    SetIndexStyle(0,DRAW_LINE);
    SetIndexBuffer(0,Buffer);
    SetIndexStyle(1,DRAW_LINE);
    SetIndexBuffer(1,EMA);
//----
    return(0);
}

//+------------------------------------------------------------------+
//| Parabolic Sell And Reverse system                                |
//+------------------------------------------------------------------+
int start()
  {
   int limit;
   int counted_bars=IndicatorCounted();

//---- check for possible errors
   if(counted_bars<0)
   {
      return(-1);
   }
//---- last counted bar will be recounted
   if(counted_bars>0) counted_bars--;
   limit=Bars-counted_bars;

//---- do it


    for(int i=limit-1; i>=0; i--)
    {
        // Easy to read
        double HD = High[Highest(NULL,0,MODE_HIGH,(iPeriod* 20),i)];
        double LD = Low[Lowest(NULL,0,MODE_LOW,(iPeriod* 20),i)];
        double amplitude = HD - LD;
        Buffer[i]= ((Close[i]-(HD-(amplitude/2)))/amplitude) * iPeriod;
        EMA[i]=EMA[i+1]+2.0/(1.0+EMAPeriod)*(Buffer[i]-EMA[i+1]);
    }

//----
   return(0);
  }
//+------------------------------------------------------------------+
Sample
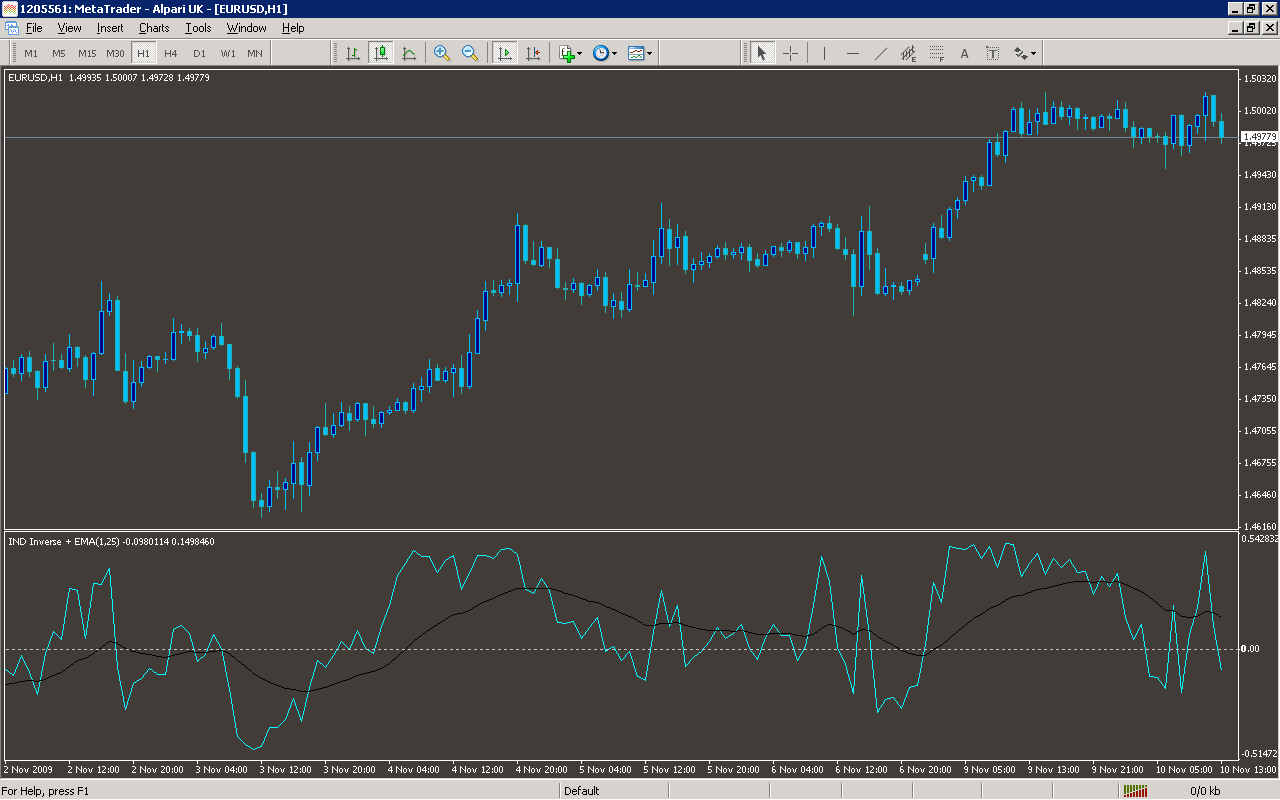
Analysis
Market Information Used:
Series array that contains the highest prices of each bar
Series array that contains the lowest prices of each bar
Series array that contains close prices for each bar
Indicator Curves created:
Implements a curve of type DRAW_LINE
Indicators Used:
Custom Indicators Used:
Order Management characteristics:
Other Features: