//+------------------------------------------------------------------+
//|                                   IND Inverse and BB and EMA.mq4 |
//+------------------------------------------------------------------+
#property copyright "Copyright © 2006, ..."
// modified by ALeX
#property link      "http://www.forex-tsd.com/"

#property indicator_separate_window
#property indicator_buffers 5
#property indicator_color1 Silver
#property indicator_color2 Orange
#property indicator_color3 Orange
#property indicator_color4 Red
#property indicator_color5 Aqua

//---- input parameters
extern int RSIPeriod = 14;
extern int BandPeriod = 20;
extern int EMA_val = 5;
extern double SD_Coeff = 1.3185;

//---- buffers
double Buffer[];
double UpZone[],DnZone[];
double bufMA[], bufEMA[];

extern int iPeriod = 1;

//----
//+------------------------------------------------------------------+
//| Init                                                             |
//+------------------------------------------------------------------+
int init()
{
//---- indicators
//    IndicatorDigits(Digits+2);
    SetIndexStyle(0,DRAW_LINE);
    SetIndexBuffer(0,Buffer);

   SetIndexStyle(1,DRAW_LINE);
   SetIndexStyle(2,DRAW_LINE);
   SetIndexStyle(3,DRAW_LINE);
   SetIndexStyle(4,DRAW_LINE);
   SetIndexBuffer(1,UpZone);
   SetIndexBuffer(2,DnZone);
   SetIndexBuffer(3,bufMA);
   SetIndexBuffer(4,bufEMA);

//----
    return(0);
}

//+------------------------------------------------------------------+
//| Parabolic Sell And Reverse system                                |
//+------------------------------------------------------------------+
int start()
  {
   int limit, i;
   int counted_bars=IndicatorCounted();
   double HD, LD, amplitude;

   double MA, RSI[];
   ArrayResize(RSI,BandPeriod);

//---- check for possible errors
   if(counted_bars<0)
   {
      return(-1);
   }
//---- last counted bar will be recounted
   if(counted_bars > 0)
     counted_bars--;
   limit=Bars-counted_bars;

//---- do it


    for (i=limit-1; i>=0; i--)
    {
        // Easy to read
        HD = High[Highest(NULL,0,MODE_HIGH,(iPeriod* 20),i)];
        LD = Low[Lowest(NULL,0,MODE_LOW,(iPeriod* 20),i)];
        amplitude = HD - LD;
        Buffer[i]= ((Close[i]-(HD-(amplitude/2)))/amplitude) * iPeriod;


//      RSIBuf[i] = iRSI(NULL,0,RSIPeriod,PRICE_WEIGHTED,i);
      MA = 0;
      for(int j=i; j<i+BandPeriod; j++) {
         RSI[j-i] = Buffer[j];
         MA += Buffer[j]/BandPeriod;
      }
      UpZone[i] = MA + (SD_Coeff * StDev(RSI,BandPeriod));
      DnZone[i] = MA - (SD_Coeff * StDev(RSI,BandPeriod));
      bufMA[i] = MA;
    }

    for (i=limit-1-EMA_val; i>=0; i--)
      bufEMA[i] = iMAOnArray (Buffer,0,EMA_val,0,MODE_EMA,i);

//----
   return(0);
  }
//+------------------------------------------------------------------+

double StDev(double& Data[], int Per)
{
  return(MathSqrt(Variance(Data,Per)));
}

double Variance(double& Data[], int Per)
{
  double sum, ssum;
  for (int i=0; i<Per; i++)
  {
    sum += Data[i];
    ssum += MathPow(Data[i],2);
  }
  return((ssum*Per - sum*sum)/(Per*(Per-1)));
}
Sample
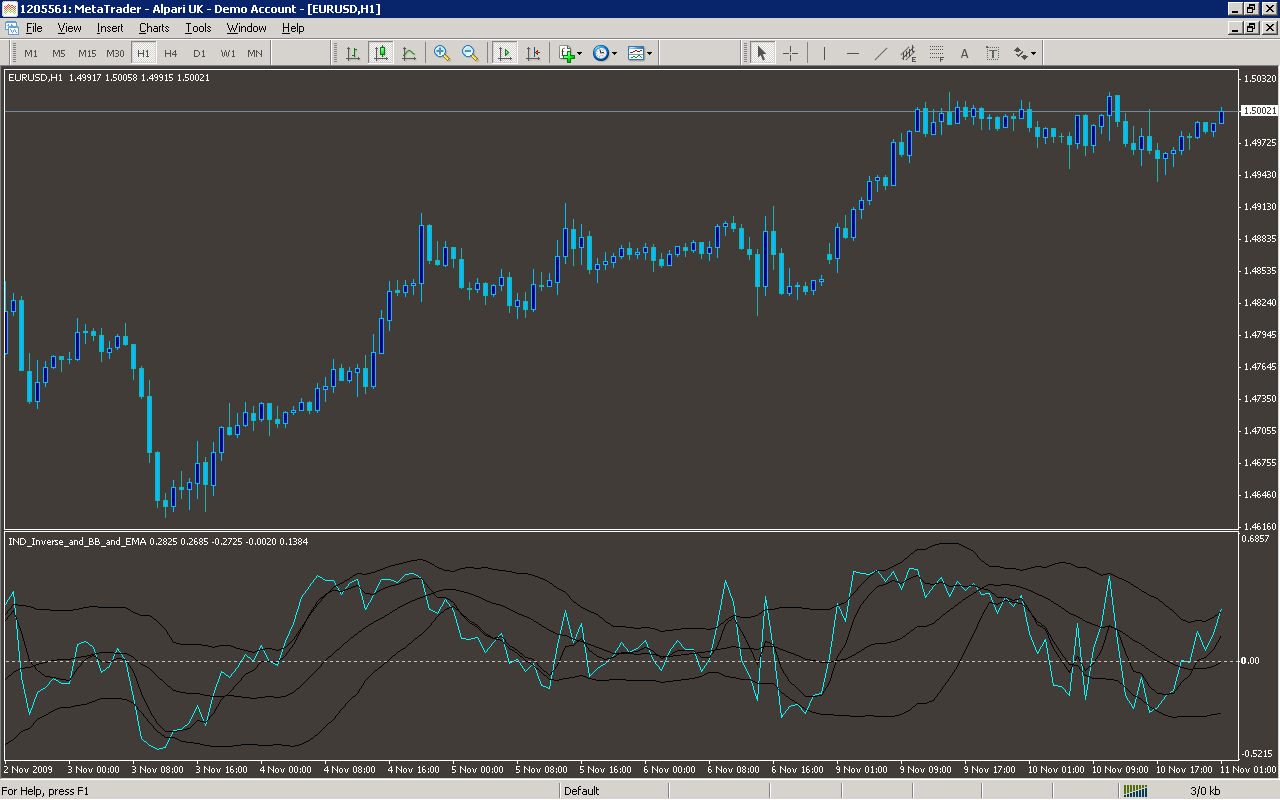
Analysis
Market Information Used:
Series array that contains the highest prices of each bar
Series array that contains the lowest prices of each bar
Series array that contains close prices for each bar
Indicator Curves created:
Implements a curve of type DRAW_LINE
Indicators Used:
Custom Indicators Used:
Order Management characteristics:
Other Features: