//+------------------------------------------------------------------+
//|                                      Indraws Volume Analysis.mq4 |
//+------------------------------------------------------------------+

#property copyright "Copyright © 2007, Ryan Klefas"
#property link      "http://www.metaquotes.com"

#property indicator_separate_window
#property indicator_buffers 3
#property indicator_color1 DodgerBlue
#property indicator_color2 Red
#property indicator_color3 Violet


double directionUpBuffer[];
double directionDownBuffer[];
double outputBuffer[];


extern int  SwingPoint_Periods=50;
extern bool Backtesting=false;
extern bool ShowArrows=false;
extern bool Normalization=true;


int accumVol=0;


//+------------------------------------------------------------------+
//| Custom indicator initialization function                         |
//+------------------------------------------------------------------+
int init()
  {
//---- indicators
   SetIndexStyle(0, DRAW_ARROW, EMPTY, 2);
   SetIndexArrow(0, 233);
   SetIndexBuffer(0, directionUpBuffer);
   SetIndexStyle(1, DRAW_ARROW, EMPTY, 2);
   SetIndexArrow(1, 234);
   SetIndexBuffer(1, directionDownBuffer);
   SetIndexStyle(2,DRAW_HISTOGRAM);
   SetIndexBuffer(2,outputBuffer);


//----
   return(0);
  }
//+------------------------------------------------------------------+
//| Custom indicator deinitialization function                       |
//+------------------------------------------------------------------+
int deinit()
  {
//----
   Comment(" ");
//----
   return(0);
  }
//+------------------------------------------------------------------+
//| Custom indicator iteration function                              |
//+------------------------------------------------------------------+
int start()
{

//+------------------------------------------------------------------+

   int i, counter, limiter;
   double d, m;

   int counted_bars=IndicatorCounted();
   if(counted_bars<0) return(-1);
   if(counted_bars>0) counted_bars--;

   int limit=Bars-counted_bars;


   // Backtesting selection is to save the computer some processing time
   // Useful for more intensive indicators
   // Disabled by default


   if (Backtesting)
   {
      limiter = limit;
      Comment("Backtesting Mode Enabled");
   }
   else
   {
      limiter = 1000;
   }


   for(i = limiter; i > 0; i--)
   {
      if (highPoint(i))
      {
         if (ShowArrows)
            directionDownBuffer[i] = 0;

         accumVol=0;
      }


      if (lowPoint(i))
      {
         if (ShowArrows)
            directionUpBuffer[i] = 0;

         accumVol=0;
      }


         if (bearish(i))
            m = MathAbs(Low[i] - Close[i]);
         if (bullish(i))
            m = MathAbs(High[i] - Close[i]);

         d = (High[i]-Low[i]) / m;

         accumVol+=Volume[i];


         if (Normalization)
            outputBuffer[i]=accumVol/d;
         else
            outputBuffer[i]=accumVol;


   }

//+------------------------------------------------------------------+

   return(0);
}

//+------------------------------------------------------------------+
//| indicator functions                                              |
//+------------------------------------------------------------------+

double swingPoint(int shift)
{
   double val = iCustom(NULL, 0, "Swing_Point", SwingPoint_Periods, 0, shift);

   if (val < 99999999)     return (val);
   else                    return (-10);
}

//+------------------------------------------------------------------+

bool highPoint(int shift)
{  return (High[shift]==swingPoint(shift));  }

//+------------------------------------------------------------------+

bool lowPoint(int shift)
{  return (Low[shift]==swingPoint(shift));  }

//+------------------------------------------------------------------+

bool bearish(int shift)
{  return (Open[shift] < Close[shift]);  }

//+------------------------------------------------------------------+

bool bullish(int shift)
{  return (Open[shift] > Close[shift]);  }

//+------------------------------------------------------------------+

//+------------------------------------------------------------------+

//+------------------------------------------------------------------+

//+------------------------------------------------------------------+

//+------------------------------------------------------------------+

//+------------------------------------------------------------------+
Sample
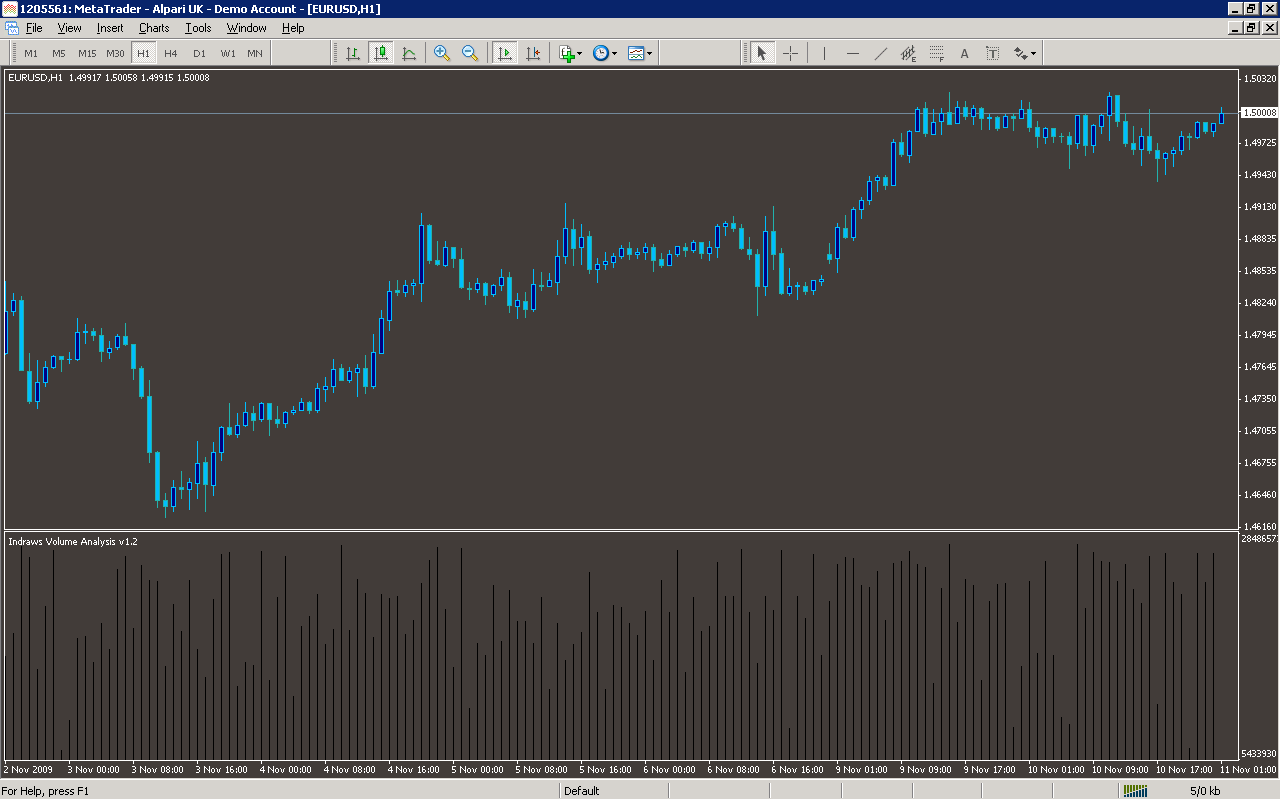
Analysis
Market Information Used:
Series array that contains close prices for each bar
Series array that contains the lowest prices of each bar
Series array that contains the highest prices of each bar
Series array that contains tick volumes of each bar
Series array that contains open prices of each bar
Indicator Curves created:
Implements a curve of type DRAW_ARROW
Implements a curve of type DRAW_HISTOGRAM
Indicators Used:
Custom Indicators Used:
Swing_Point
Order Management characteristics:
Other Features: