//+------------------------------------------------------------------+
//|                                                    DOSR_Dots.mq4 |
//|                                                          Kalenzo |
//| InnBar mtf                               http://www.fxservice.eu |
//+------------------------------------------------------------------+
//mod2008 fxtsd  ki

#property copyright "Kalenzo"
#property link      "http://www.fxservice.eu"
#property indicator_buffers 4
#property indicator_color1 Maroon
#property indicator_color2 CLR_NONE
#property indicator_color3 MediumVioletRed
#property indicator_color4 CLR_NONE

#property indicator_width3 3

double val1[];
double val2[];
double val11[];
double val12[];

extern int TimeFrame =60;
extern string  TimeFrames="M1;5,15,30,60H1;240H4;1440D1;10080W1;43200MN|0-CurrTF";

#property indicator_chart_window

//+---


int init()
  {
//---

   IndicatorBuffers (4);

   SetIndexBuffer(0,val11);
   SetIndexBuffer(1,val12);
   SetIndexBuffer(2,val1);
   SetIndexBuffer(3,val2);


   SetIndexStyle(0,DRAW_HISTOGRAM);
   SetIndexStyle(2,DRAW_HISTOGRAM);

   TimeFrame=MathMax(TimeFrame,Period());
   if (TimeFrame>Period())
      {
   SetIndexShift(0,1);
   SetIndexShift(2,TimeFrame/Period()-1);
      }
   else
      {
      SetIndexShift(0,0);
      SetIndexShift(2,0);
      }

   SetIndexEmptyValue(0,EMPTY_VALUE);
   SetIndexEmptyValue(1,EMPTY_VALUE);
   SetIndexEmptyValue(2,EMPTY_VALUE);
   SetIndexEmptyValue(3,EMPTY_VALUE);


   SetIndexLabel(0,"insideBar hi lo");
   SetIndexLabel(1,"prev Bar hi lo");


   return(0);
  }
//+--

int deinit()
  {

   return(0);
  }
//+---

int start()
  {
      datetime TimeArray[];

      int i,y,limit;
      int counted_bars=IndicatorCounted();

      if(counted_bars<0) return(-1);
      if(counted_bars>0) counted_bars--;


      limit=Bars-counted_bars;
      limit=MathMax(limit,TimeFrame/Period());

      ArrayCopySeries(TimeArray, MODE_TIME,Symbol(),TimeFrame);


      for( i=0, y=0; i<limit; i++)
      {
       if (Time[i]<TimeArray[y]) y++;


    double      H1 = iHigh(Symbol(),TimeFrame,y+1);
    double      L1 = iLow (Symbol(),TimeFrame,y+1);

    double      H  = iHigh(Symbol(),TimeFrame,y);
    double      L  = iLow (Symbol(),TimeFrame,y);

       if  (H1>H && L1<L)
            {
               if  (Time[i]==TimeArray[y])
                     {
                     val1[i]=H;
                     val2[i]=L;

                     val11[i]=H1;
                     val12[i]=L1;
                      }

              }

      }


//----
   return(0);
  }
//+------------------------------------------------------------------+
Sample
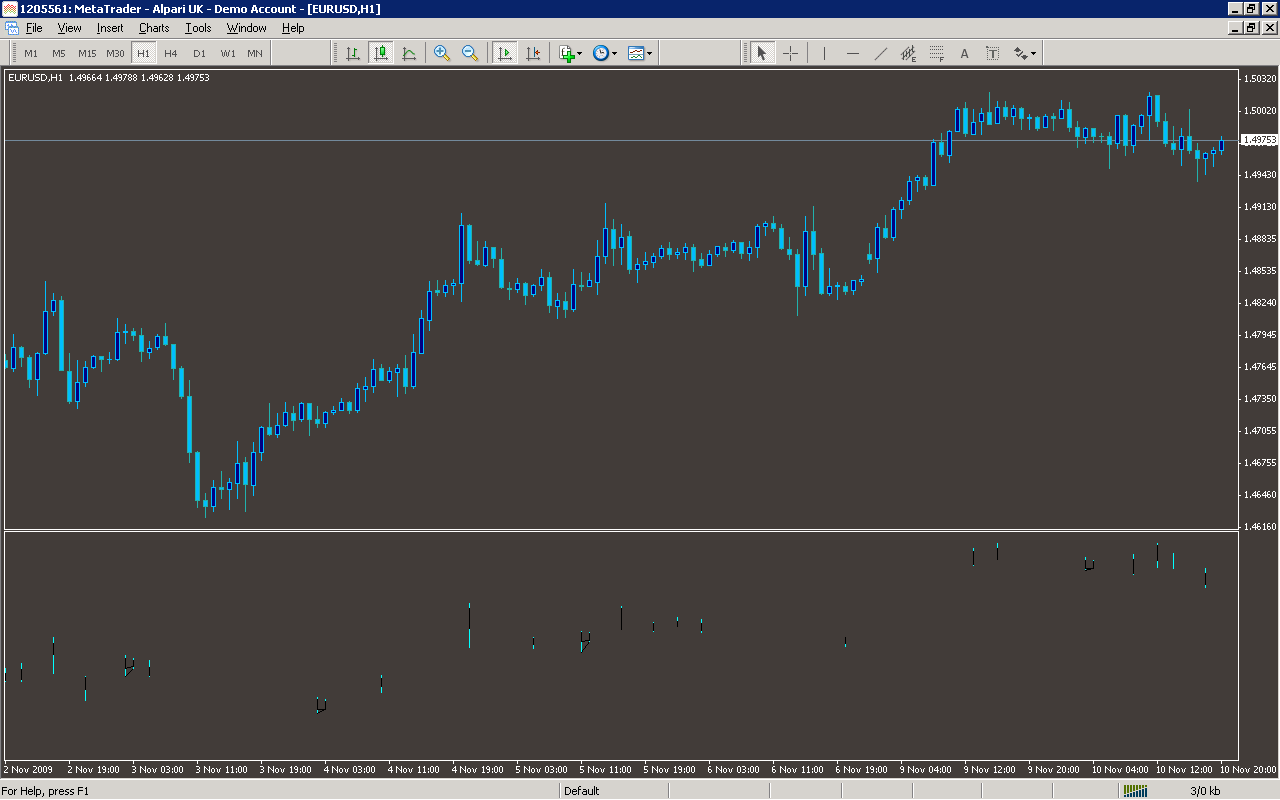
Analysis
Market Information Used:
Series array that contains open time of each bar
Series array that contains the highest prices of each bar
Indicator Curves created:
Implements a curve of type DRAW_HISTOGRAM
Indicators Used:
Custom Indicators Used:
Order Management characteristics:
Other Features: