//+------------------------------------------------------------------+
//|                          Instantaneous Trend Line by John Ehlers |
//|                               Copyright © 2004, Poul_Trade_Forum |
//|                                                         Aborigen |
//|                                          http://forex.kbpauk.ru/ |
//+------------------------------------------------------------------+
#property copyright "Poul Trade Forum"
#property link      "http://forex.kbpauk.ru/"
#property indicator_chart_window
#property indicator_buffers 2
#property indicator_color1 Red
#property indicator_color2 Blue
//---- buffers
double TRBuffer[];
double ZLBuffer[];
double Value1[],Value2,Value3,Value4,Value5[2],Value11[2];
double Price[],InPhase[2],Quadrature[2],Phase[2],DeltaPhase[],InstPeriod[2],Period_,Trendline;
double test[];
//+------------------------------------------------------------------+
//| Custom indicator initialization function                         |
//+------------------------------------------------------------------+
int init()
  {
   string short_name;
   IndicatorBuffers(5);
//---- indicator line
   SetIndexStyle(0,DRAW_LINE,EMPTY,2,Red);
   SetIndexStyle(1,DRAW_LINE,EMPTY,2,Blue);
   SetIndexBuffer(0,TRBuffer);
   SetIndexBuffer(1,ZLBuffer);
   SetIndexBuffer(2,Value1);
   SetIndexBuffer(3,Price);
   SetIndexBuffer(4,DeltaPhase);

   SetIndexEmptyValue(0,0);
   SetIndexEmptyValue(1,0);
//---- name for DataWindow and indicator subwindow label
   short_name="Instantaneous Trend";
   IndicatorShortName(short_name);
   SetIndexLabel(0,short_name);
//----
   SetIndexDrawBegin(0,30);
   SetIndexDrawBegin(1,30);
//----

   return(0);
  }

int deinit(){return(0);}
int start()
  {
   int    counted_bars=IndicatorCounted(),i,shift,count;


if (counted_bars==0) counted_bars=100;
i=(Bars-counted_bars)-2;
for (shift=i; shift>=0;shift--)
{
InPhase[1] =InPhase[0]; Quadrature[1] =Quadrature[0];
Phase[1]=Phase[0]; InstPeriod[1] = InstPeriod[0];
Value5[1] =Value5[0];Value11[1] =Value11[0];
Price[shift]=(High[shift+1]+Low[shift+1])/2;
//  {Compute InPhase and Quadrature components}
   Value1[shift] = Price[shift] - Price[shift+6];
   Value2 =Value1[shift+3];
   Value3 =0.75*(Value1[shift] - Value1[shift+6]) + 0.25*(Value1[shift+2] - Value1[shift+4]);
   InPhase[0] = 0.33*Value2 + 0.67*InPhase[1];
   Quadrature[0] = 0.2*Value3 + 0.8*Quadrature[1];

//   {Use ArcTangent to compute the current phase}
if (MathAbs(InPhase[0]+InPhase[1])>0) Phase[0]=MathArctan(MathAbs((Quadrature[0]+Quadrature[1])/(InPhase[0]+InPhase[1])));
//   {Resolve the ArcTangent ambiguity}
   if (InPhase[0] < 0 && Quadrature[0] > 0)  Phase[0] = 180 - Phase[0];
   if (InPhase[0] < 0 && Quadrature[0] < 0)  Phase[0] = 180 + Phase[0];
   if (InPhase[0] > 0 && Quadrature[0] < 0)  Phase[0] = 360 - Phase[0];

//   {Compute a differential    phase, resolve phase wraparound, and limit delta phase errors}
   DeltaPhase[shift] = Phase[1] - Phase[0];
   if (Phase[1] < 90 &&  Phase[0] > 270) DeltaPhase[shift] = 360 + Phase[1] - Phase[0];
   if (DeltaPhase[shift] < 1)  DeltaPhase[shift] = 1;
   if (DeltaPhase[shift] > 60) DeltaPhase[shift] = 60;

//   {Sum DeltaPhases  to reach 360  degrees. The sum is the instantaneous period.}
   InstPeriod[0] = 0;
   Value4 = 0;
   for (count = 0;count<=40;count++)
      {
       Value4 = Value4 + DeltaPhase[shift+count];
       if  (Value4 > 360 && InstPeriod[0]  == 0) InstPeriod[0] = count;
     }
//   {Resolve Instantaneous  Period    errors and  smooth}
   if (InstPeriod[0] == 0) InstPeriod[0] = InstPeriod[1];
   Value5[0] = 0.25*(InstPeriod[0]) + 0.75*Value5[1];

//   {Compute Trendline as simple average over the measured dominant cycle period}
   Period_ = MathCeil(Value5[0]); Trendline = 0;///Period_ = IntPortion(Value5)
   for    (count = 0;count<=Period_ + 1;count++)
       { Trendline = Trendline + Price[shift+count]; }

   if (Period_ > 0) Trendline = Trendline    / (Period_  + 2);
   Value11[0] = 0.33*(Price[shift] + 0.5*(Price[shift] - Price[shift+3])) + 0.67*Value11[1];

   TRBuffer[shift]=Trendline;
   ZLBuffer[shift]=Value11[0];

//----
}
/*
Comment("Last Tick:",TimeToStr(CurTime(),TIME_DATE|TIME_SECONDS),"\n",
        "Instant Trendline","\n",
        "Red Trend: ",TRBuffer[0],"\n",
        "Blue Trend: ",ZLBuffer[0]);*/
return(0);
}
Sample
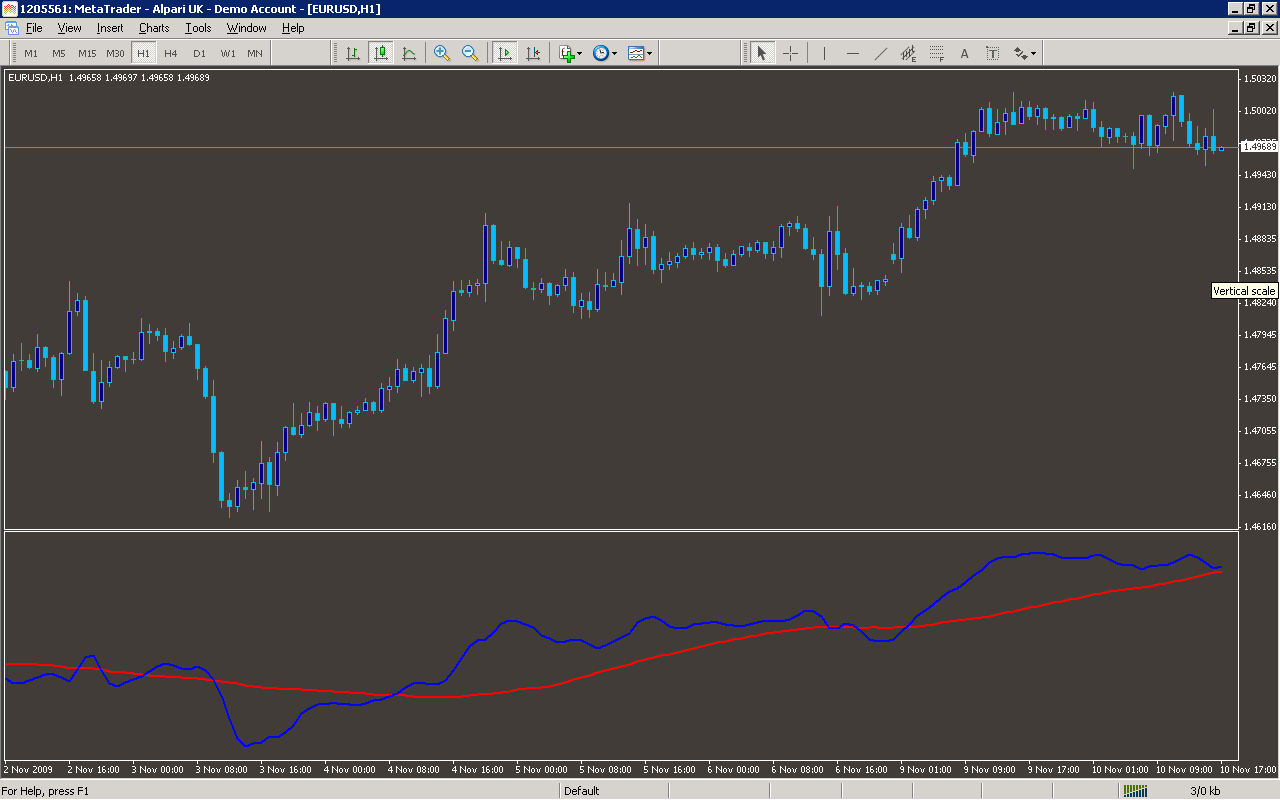
Analysis
Market Information Used:
Series array that contains the highest prices of each bar
Series array that contains the lowest prices of each bar
Indicator Curves created:
Implements a curve of type DRAW_LINE
Indicators Used:
Custom Indicators Used:
Order Management characteristics:
Other Features: