//+------------------------------------------------------------------+
//|                                       InstantaneousTrendline.mq4 |
//|                                                                  |
//| Instantaneous Trendline                                          |
//|                                                                  |
//| Algorithm taken from book                                        |
//|     "Cybernetics Analysis for Stock and Futures"                 |
//| by John F. Ehlers                                                |
//|                                                                  |
//|                                              contact@mqlsoft.com |
//|                                          http://www.mqlsoft.com/ |
//|                                                                  |
//|                                     Recoded by:                  |
//|                                     "Wylie" dazzle.html@live.com |
//+------------------------------------------------------------------+

#property copyright "Coded by Witold Wozniak"
#property link      "www.mqlsoft.com"

#property indicator_chart_window
#property indicator_buffers 4
#property indicator_color1 Orange
#property indicator_color2 White
#property indicator_level1 0

extern color    Phase1color   = White;
extern color    Phase2color   = Orange;
extern double   Alpha         = 0.07;
extern bool     EnableAlerts  = true;
extern bool     EnableArrows  = true;
extern int      ArrowUPsize   = 1;
extern int      ArrowDNsize   = 1;
extern color    ArrowUPcolor  = White;
extern color    ArrowDNcolor  = Orange;

double          ITrend[],Trigger[],CrossUp[],CrossDn[],Clearance;
int             buffers = 0,MinBars = 0,AST;
string          Chart;
static datetime AlertX[2];

/*+-------------------------------------------------------------------+
  | InstantaneousTrendline Initialization                             |
  +-------------------------------------------------------------------+*/

int init()
{
 MinBars = 20;
 IndicatorBuffers(4);
 IndicatorShortName("Instantaneous Trendline [" + DoubleToStr(Alpha, 2) + "]");

 // Index Buffer 0

 SetIndexBuffer(0,ITrend);
 SetIndexLabel(0,"Instantaneous Trendline");
 SetIndexStyle(0,DRAW_LINE,STYLE_SOLID,1,Phase1color);
 SetIndexShift(0,0);
 SetIndexEmptyValue(0,EMPTY_VALUE);
 SetIndexDrawBegin(0,MinBars);

 // Index Buffer 1

 SetIndexBuffer(1,Trigger);
 SetIndexStyle(1,DRAW_LINE,STYLE_SOLID,1,Phase2color);
 SetIndexLabel(1,"Trigger");
 SetIndexShift(1,0);
 SetIndexEmptyValue(1,EMPTY_VALUE);
 SetIndexDrawBegin(1,MinBars);

 // Index Buffer 2

 SetIndexBuffer(2,CrossUp);
 SetIndexStyle(2,DRAW_ARROW,STYLE_SOLID,ArrowUPsize,ArrowUPcolor);
 SetIndexLabel(2,"ArrowUP");
 SetIndexShift(2,0);
 SetIndexEmptyValue(2,EMPTY_VALUE);
 SetIndexArrow(2,225);
 SetIndexDrawBegin(2,MinBars);

 // Index Buffer 3

 SetIndexBuffer(3,CrossDn);
 SetIndexStyle(3,DRAW_ARROW,STYLE_SOLID,ArrowDNsize,ArrowDNcolor);
 SetIndexLabel(3,"ArrowDN");
 SetIndexShift(3,0);
 SetIndexEmptyValue(3,EMPTY_VALUE);
 SetIndexArrow(3,226);
 SetIndexDrawBegin(3,MinBars);

                                      // The "Clearance" variable below sets the distance from the trendline to the arrows...
                                      // It can be adjusted by the user to their own preference...
 switch(Period())
     {case PERIOD_M1:  Chart = "M1";  Clearance = 0.0003; AST =      59; break;
      case PERIOD_M5:  Chart = "M5";  Clearance = 0.0007; AST =     259; break;
      case PERIOD_M15: Chart = "M15"; Clearance = 0.0011; AST =     899; break;
      case PERIOD_M30: Chart = "M30"; Clearance = 0.0018; AST =    1799; break;
      case PERIOD_H1:  Chart = "H1";  Clearance = 0.0027; AST =    3599; break;
      case PERIOD_H4:  Chart = "H4";  Clearance = 0.0038; AST =   14399; break;
      case PERIOD_D1:  Chart = "D1";  Clearance = 0.0070; AST =   86399; break;
      case PERIOD_W1:  Chart = "W1";  Clearance = 0.0130; AST =  604799; break;
      case PERIOD_MN1: Chart = "MN1"; Clearance = 0.0260; AST = 2591999; break;}

 return (0);
} // int init()

/*+-------------------------------------------------------------------+
  | InstantaneousTrendline Main cycle                                 |
  +-------------------------------------------------------------------+*/

int start()
{
 if(Bars <= MinBars){return (0);}
 int countedBars = IndicatorCounted(),c,limit = Bars - countedBars - 1;

 if(countedBars < 0){return (-1);}
 if(countedBars > 0){countedBars--;}

 for(c = limit; c >= 0; c--)
     {ITrend[c] = (Alpha - (Alpha * Alpha * 0.25)) * ((High[c]   + Low[c])   * 0.5) +
                  (0.5 * Alpha * Alpha)            * ((High[c+1] + Low[c+1]) * 0.5) -
                  (Alpha - 0.75 * Alpha * Alpha)   * ((High[c+2] + Low[c+2]) * 0.5) +
                  2.0 * (1.0 - Alpha) * ITrend[c+1] - (1.0 - Alpha) * (1.0 - Alpha) * ITrend[c+2];

      if(c > Bars - 8)
         {ITrend[c] = (((High[c]   + Low[c])   * 0.5)  + 2.0 *
                       ((High[c+1] + Low[c+1]) * 0.5)  +
                       ((High[c+2] + Low[c+2]) * 0.5)) * 0.25;}

      Trigger[c] = 2.0 * ITrend[c] - ITrend[c + 2];

      double b0 = Trigger[c],b1 = Trigger[c+1],
             r0 = ITrend[c], r1 = ITrend[c+1];

      if(EnableArrows)
         {if(b0 > r0 && b1 < r1){CrossUp[c] = r0 - Clearance;}else{CrossUp[c] = EMPTY_VALUE;}
          if(b0 < r0 && b1 > r1){CrossDn[c] = r0 + Clearance;}else{CrossDn[c] = EMPTY_VALUE;}}

     } // for(c = limit; c >= 0; c--)

 if(EnableAlerts)
    {if(b0 > r0 && b1 < r1)
        {sendAlert(0,(getDateTime()+" "+Symbol()+" "+Chart+" InstantaneousTrendline signals up trend crossing."));}
     if(b0 < r0 && b1 > r1)
        {sendAlert(1,(getDateTime()+" "+Symbol()+" "+Chart+" InstantaneousTrendline signals down trend crossing."));}}

 return (0);
} // int start()

/*+-------------------------------------------------------------------+
  | End InstantaneousTrendline Main cycle                             |
  +-------------------------------------------------------------------+*/


/*+-------------------------------------------------------------------+
  | Wylie's support functions                                         |
  +-------------------------------------------------------------------+*/

/*+-------------------------------------------------------------------+
  | *** Alert processing function                                     |
  +-------------------------------------------------------------------+*/

void sendAlert(int AlertNum,string AlertText)
{
 if(TimeCurrent() > AlertX[AlertNum] + AST)
    {AlertX[AlertNum] = TimeCurrent();
                                        /* Add a sound file here if you want another form of alert...
                                           The sound file must be located in the MT4 "sounds" file folder
                                           and must be a .wav format file. Also remove the // characters before
                                           the PlaySound instruction.  The Alert command and semicolon can
                                           be removed if the user wishes to remove the alert entirely, if favor
                                           of a sound file... or it can be "commented out" just add // before
                                           the alert instruction. */

//     PlaySound("titleOFyourSoundfile.wav");
     Alert(AlertText);
    } // if(TimeCurrent() > AlertX[AlertNum] + AST)

 return(0);
} // void sendAlert(int AlertNum,string AlertText)

/*+-------------------------------------------------------------------+
  | *** Date/Time display function                                    |
  +-------------------------------------------------------------------+*/

string getDateTime()
{
 string dsplyDateTime = TimeToStr(TimeCurrent(),TIME_DATE|TIME_SECONDS);

 return(dsplyDateTime);
} // string getDateTime()

/*+-------------------------------------------------------------------+
  | End Wylie's support functions                                     |
  +-------------------------------------------------------------------+*/
Sample
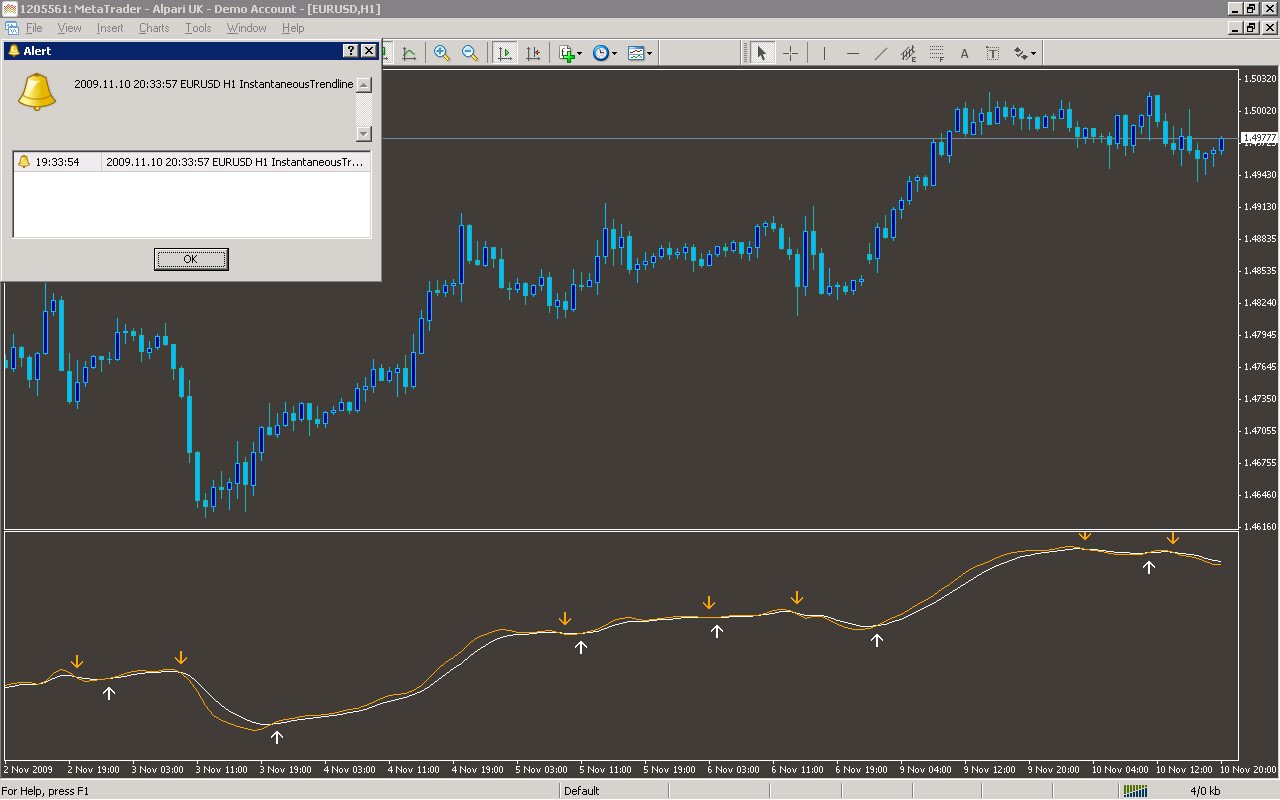
Analysis
Market Information Used:
Series array that contains the highest prices of each bar
Series array that contains the lowest prices of each bar
Indicator Curves created:
Implements a curve of type DRAW_LINE
Implements a curve of type DRAW_ARROW
Indicators Used:
Custom Indicators Used:
Order Management characteristics:
Other Features:
It issuies visual alerts to the screen